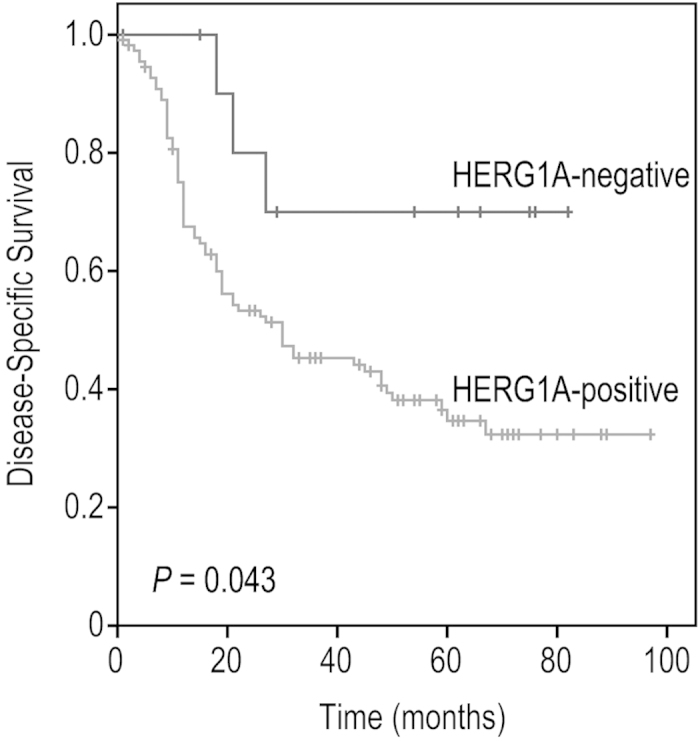
Figure 3. Kaplan-Meier disease-specific survival curves in patients with HNSCC categorised by HERG1A protein expression (positive versus negative).

P values were estimated using the log-rank test. P ≤ 0.05 was considered statistically significant.

P values were estimated using the log-rank test. P ≤ 0.05 was considered statistically significant.