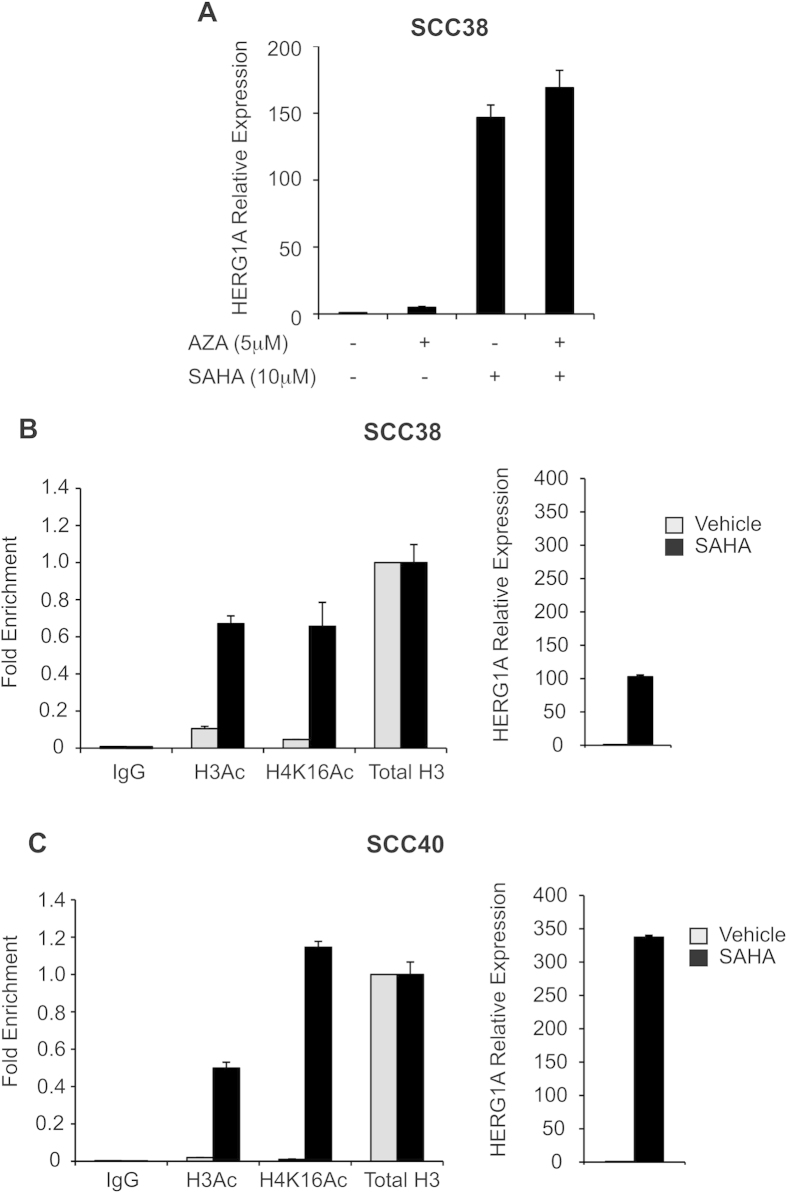
Figure 4. Epigenetic regulation of HERG1A expression.
(A) HERG1A mRNA expression levels in SCC38 cells treated with either vehicle, 5 μM AZA for 96 h, 10 μM SAHA for 24 h or a combination of both chemical agents. HERG1A expression was analysed by real-time RT-PCR and data were normalised to RPL19 mRNA levels. Histone H3 and H4 acetylation status measured by qChIP in either SCC38 cells (B) or SCC40 cells (C) treated with vehicle or 10 μM SAHA for 24 h. In vivo cross-linked chromatin was immunoprecipitated with either anti-acetyl-histone H3 (H3Ac), anti-acetyl-histone H4 (Lys 16) (H4K16Ac), histone H3 (total H3), or rabbit control IgG (IgG) and the relative histone acetylation levels analysed by qPCR. Data were normalised to IgG and relative to H3 immunoprecipitated samples. The right panel shows HERG1A expression analysis by real-time RT-PCR in either SCC38 cells (B) or SCC40 cells (C) treated with vehicle or 10 μM SAHA for 24 h.

