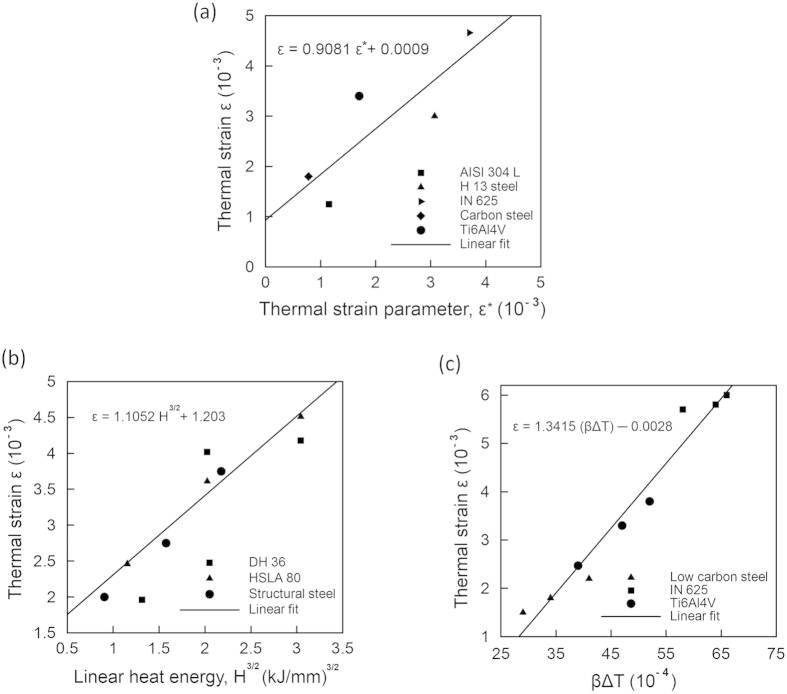
Figure 2. Values of maximum thermal strain ε.
(a) as a function of the thermal strain parameter for five alloys14,15,16,17,18 showing a linear relationship (b) as a function of H3/2 for structural steel19, tool steel20 and high strength low alloys steel20 in welding (c) as a function of βΔT for low carbon steel15, IN 62514 and Ti-6Al-4V14 in AM.

