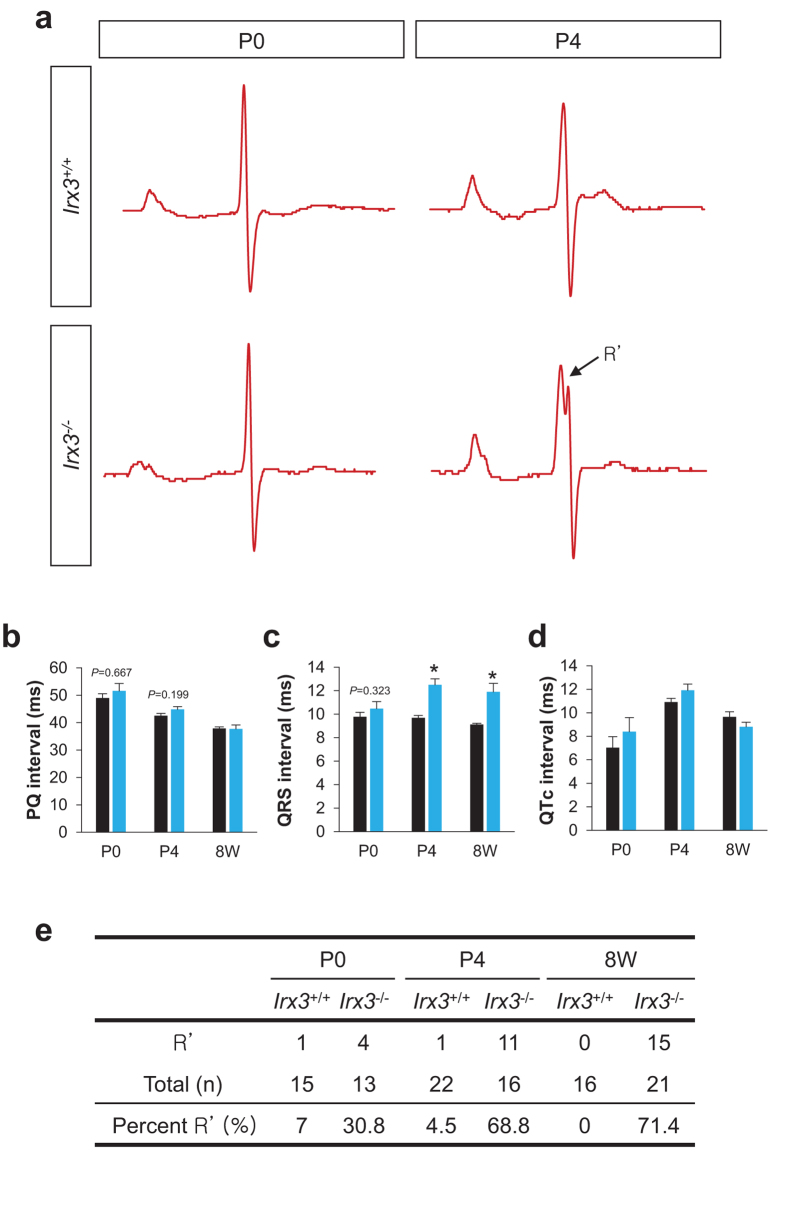
Figure 4. Postnatal electrophysiological defects in Irx3−/− mice.
(a) Representative ECG traces of Irx3+/+ and Irx3−/− mice at P0 and P4. Analysis of neonatal mouse ECGs revealed that there are no differences in PQ (b) and QTc (d) intervals between Irx3+/+ and Irx3−/− mice all different developmental stages (i.e. P0, P4 and 8 week old (8 W)). On the other hand, QRS intervals of Irx3−/− mice, (c) that were not significantly different at P0 compared to controls, became prolonged from P4 onwards. (e) The prevalence of notched R’ wave, an indicator of right bundle branch block. *P < 0.05 vs. Irx3+/+ mice.

