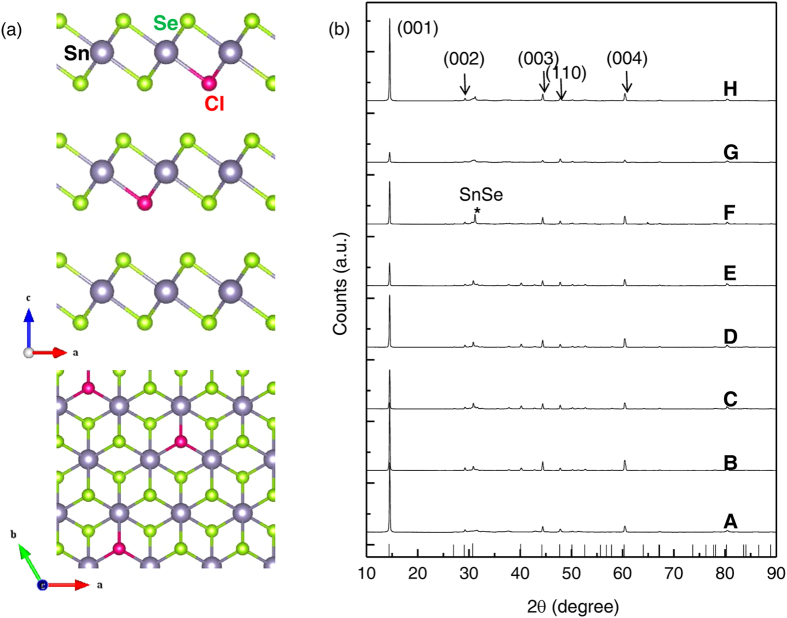
Figure 1. Structural characterizations of Cl-doped SnSe2.
(a) Schematics of crystal structure of Cl-doped SnSe2 along b- (upper) and c-axis (lower). (b) The patterns of powder X-ray diffraction from various amount of Cl-doped SnSe2 samples [A: undoped (ne = 7.2 × 1017 cm−3), B–H: doped samples with increasing Cl doping ratio from B (ne = 5.1 × 1018 cm−3) to H (ne = 8.6 × 1019 cm−3)]. Reference peak positions of SnSe2 are displayed at the bottom of the graph. Representative lattice planes are indicated and SnSe impurity phase is marked with arrows and asterisk, respectively.

