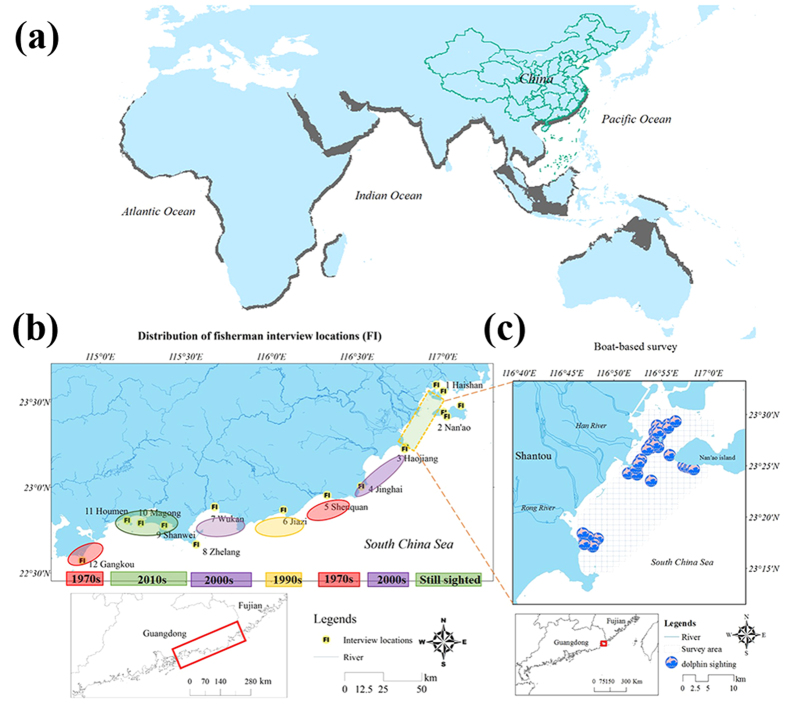
Figure 1. Survey maps.
(a) The global distribution ranges of humpback dolphin (genus Sousa), shown as shaded regions along the coasts; (b) Eastern Guangdong coastline (from XM to PRE) showing the distribution of fishermen interview locations (FI), the color bar and the times under the map, which were derived from the interview data, indicate the possible IPHBD subpopulation temporal changes (the time when the distribution gap occurred); (c) Shantou waters, showing the boat-based survey area (grids area). Inset map underneath is a map of Guangdong and Fujian showing the location of the study area (boxed action). We created the maps with the program ArcMap of ArcGIS [10.2.2] (http://www.esri.com/software/arcgis). Map (a) was developed from previously reported global population distribution data of the humpback dolphin27,28,29,30.

