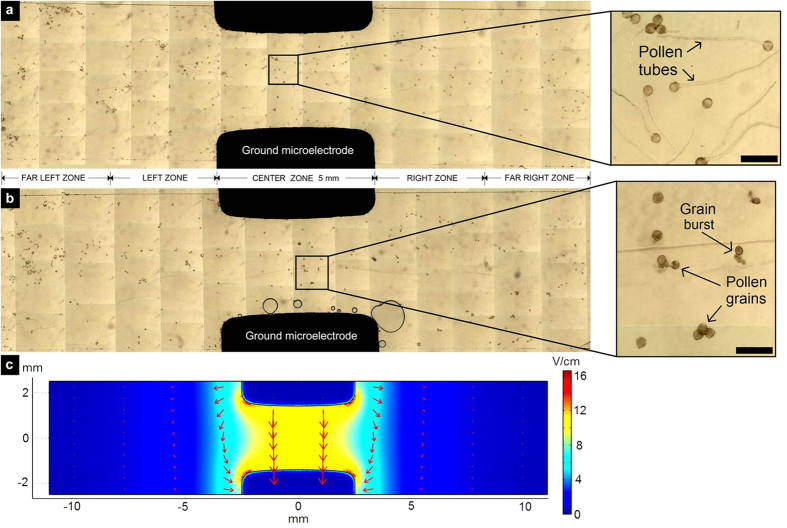
Figure 4. Electric field conditions and simulation.
(a,b) Stitched micrograph of germinated pollen in DC batch electric chamber at 0 V (a), and 3.0 V (b). Scale bars on both zoom-ins = 200 μm. (c) Simulated electric field norm [V/cm] within the electrical chamber for a constant 3 V input. Arrows: electric field direction and normalized intensity.

