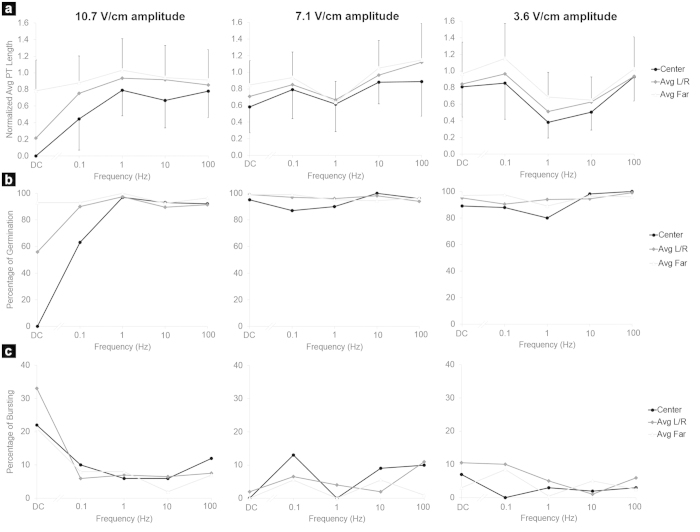
Figure 7. Effect of batch AC electric fields on pollen tube growth (n = 3362).
(a) Average pollen tube length in different zones of the chamber normalized to the average control value (510 μm). (b) Percentage of germination. (c) Percentage of pollen bursting. The frequency applied is indicated on the x-axis. Each column corresponds to a different field amplitude. L/R = pooled data from Left and Right Zones, Far = pooled data from Far left and right zones. For clarity, the standard deviation in a) is only indicated for the Center and Far zones.

