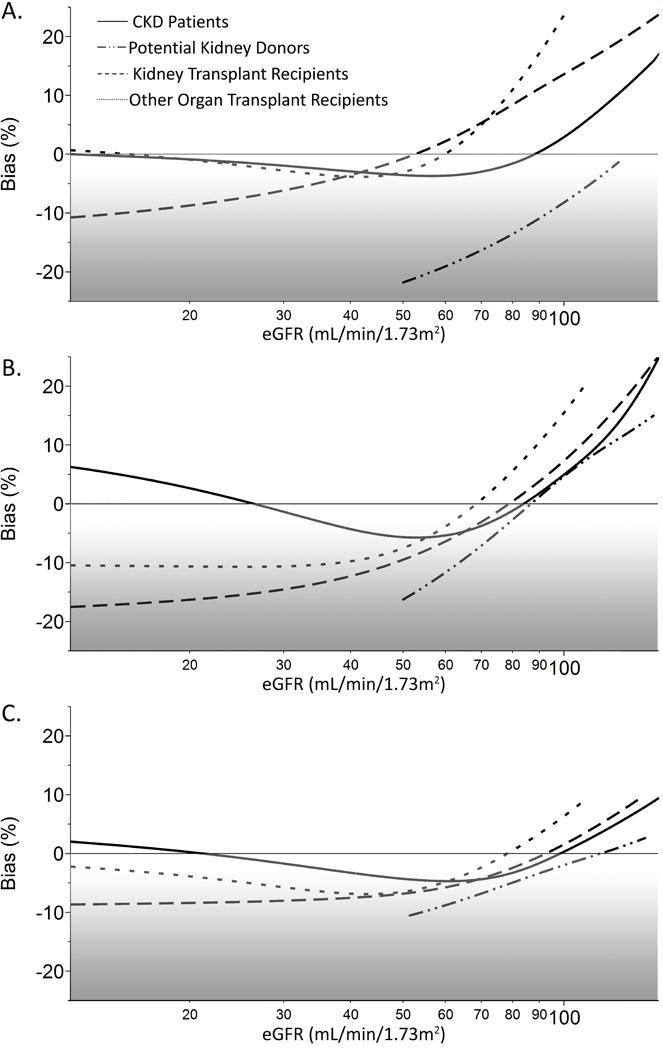
Figure 2. Equation bias as a function of eGFR.

Bias (exp[log eGFR − log mGFR] − 1) plotted as a function of (A) eGFRCr, (B) eGFRCys, and (C) eGFRCr-Cys for CKD patients (solid), potential kidney donors (dash-dot), kidney transplant recipients (dotted), and other-organ transplant recipients (dashed).
