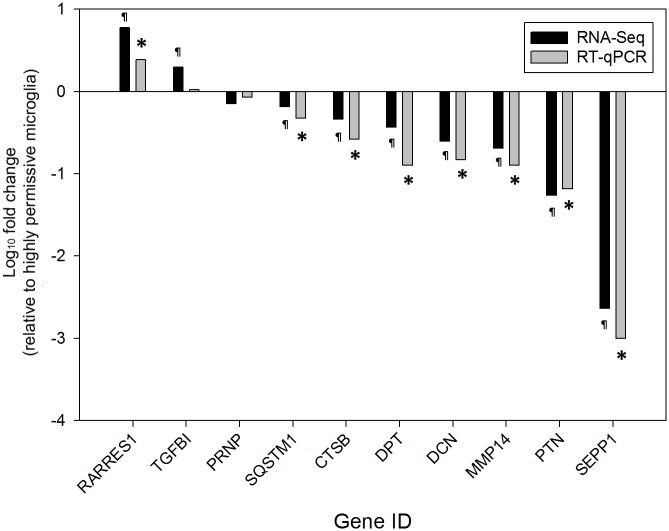
Fig 5. Validation of RNA-Seq results by RT-qPCR.
The fold changes in transcription of 10 genes across nine culture replicates of ovine microglia clones inoculated with scrapie prions are shown. Black bars represent RNA-Seq results and gray bars represent RT-qPCR results. RNA-Seq results were confirmed by RT-qPCR in 9 of 10 cases. ¶: P < 0.05. *: P < 0.0001. Gene IDs are on the x—axis. The log10 fold change in transcription relative to highly permissive microglia is on the y—axis. Thus, positive fold changes indicate upregulation in highly permissive microglia and negative fold changes indicate upregulation in poorly permissive microglia.

