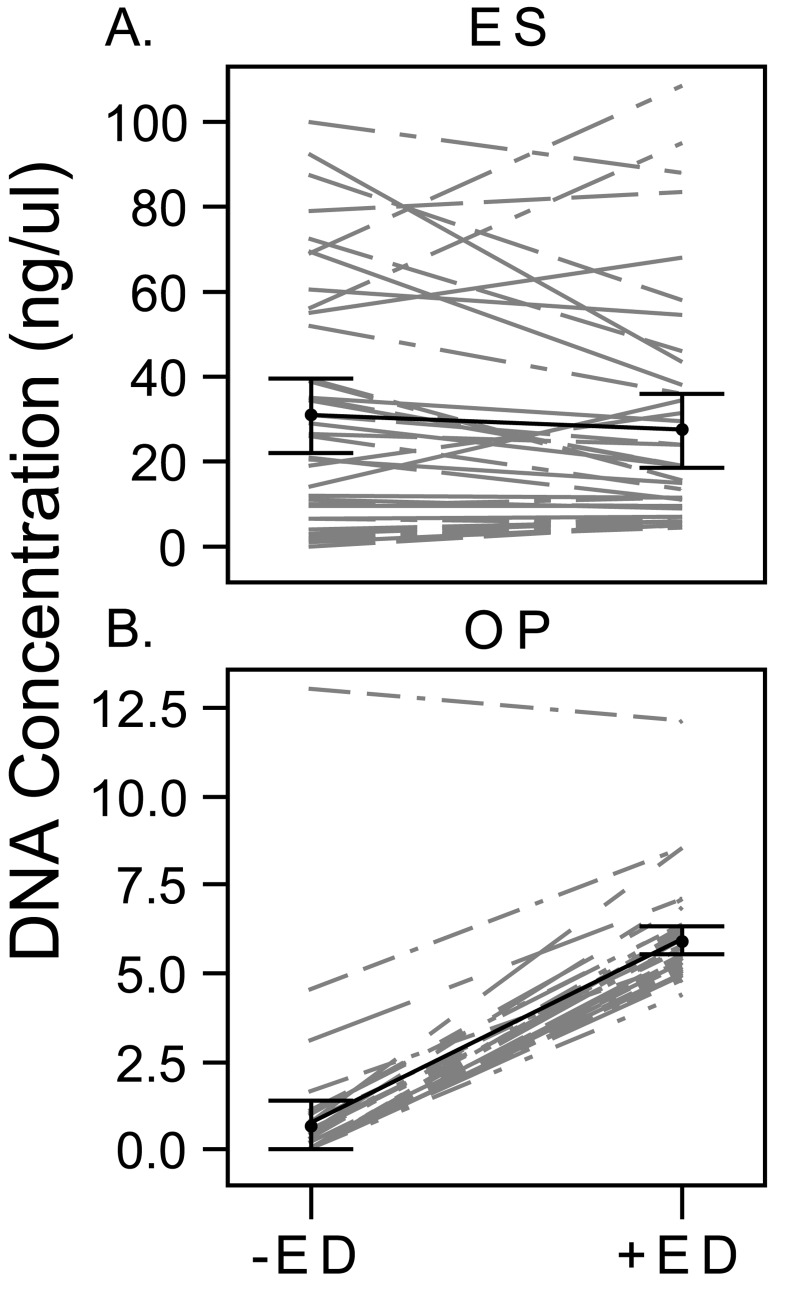
Fig 2. Comparison of DNA Concentration with and without Enzymatic Digestion.
DNA concentration is shown for each paired sample of DNA extractions with and without enzymatic digestion for ES (A) and OP (B). The average concentration for all samples with each extraction approach is shown in black with 95% confidence intervals indicated by the whiskers.

