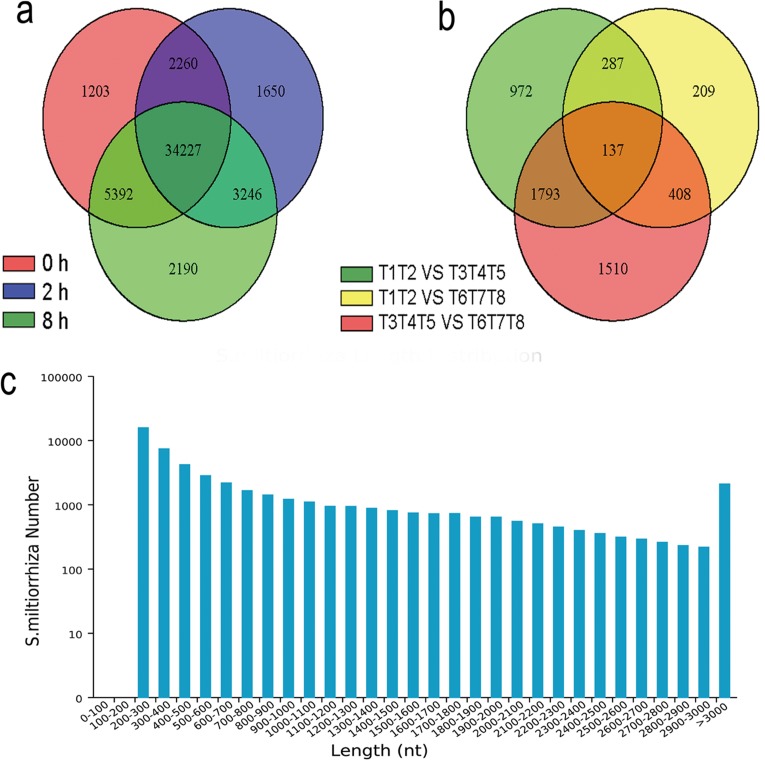
Fig 1. mRNA profiling of SA induced S. miltiorrhiza cell cultures by RNA-seq.
(a) The common and unique expression profiles among sample groups. Numbers represent expressed unigenes in control (0 h) and SA (2 h and 8 h) treated cell cultures. (b) Number of DEGs found among different sample groups, according to a FDR< 0.01 and FC ≥ 2 or ≤ -2. T1, T2 belong to control group, T3, T4 and T5 belong to treatment group of SA induction for 2 h, T6, T7 and T8 belong to treatment group of SA induction for 8 h. (c) Length distribution of the 50 778 assembled unigenes (digital details see S3 Table).

