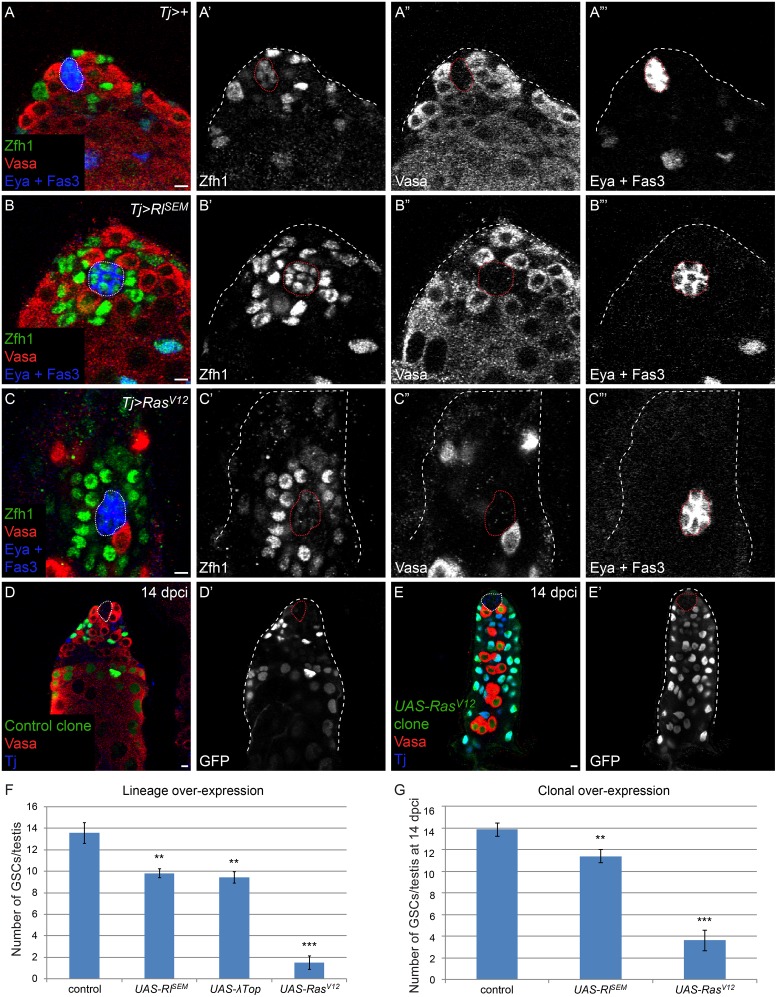
Fig 2. MAPK gain-of-function in CySCs causes them to out-compete GSCs at the niche.
A) A normal complement of Vasa-positive GSCs and Zfh1-positive CySCs at the niche and Eya-positive differentiating cyst cells is observed in a control a Tj-Gal4 (Tj>+) testis. B) GSCs are displaced by CySCs over-expressing dominant-active form of MAPK (RlSEM). C) GSCs are almost entirely out-competed by CySCs over-expressing a dominant-active Ras (RasV12). In this image, only one GSC remains in contact with the niche and there are numerous CySCs immediately contacting hub cells. We note that the position of the hub frequently shifts slightly basally in Tj>RasV12 over-expressing testes. D) A testis with control MARCM clones at 14 dpci, identified by the expression of GFP within the clone. Note that some CySCs and their differentiating progeny are clonally marked with GFP and there is a normal complement of GSCs at the niche. E) A testis with UAS-RasV12 MARCM clones at 14 dpci. The entire somatic lineage is clonally marked, indicating that RasV12-expressing CySCs out-competed wild type CySCs. There are two GSCs in contact with the niche, indicating that RasV12-expressing CySCs also out-competed most GSCs in this testis. Germ line differentiation is also perturbed, presumably because somatic cells with high Ras activity cannot adequately support gonial cells [44]. F) Graph displaying the number of GSCs in control (Tj-Gal4), Tj>RlSEM, Tj>λTop, and Tj>RasV12 testes. GSC number is moderately but significantly reduced in Tj>RlSEM and Tj>λTop and substantially reduced in Tj>RasV12 testes. G) Graph displaying the number of GSCs in testes containing control, RlSEM-expressing and RasV12 -expressing CySC clones. Note the significant drop in GSCs when CySC clones expressing UAS-RlSEM and UAS-RasV12 are present. **P< 0.01, ***P<0.001. Vasa is red in all panels. Zfh1 is green and Fas3 and Eya are blue in A-C. MARCM clones, which express GFP, are green and Tj is blue in D and E. The hub is outlined by a dotted line. Scale bar = 5 μM.

