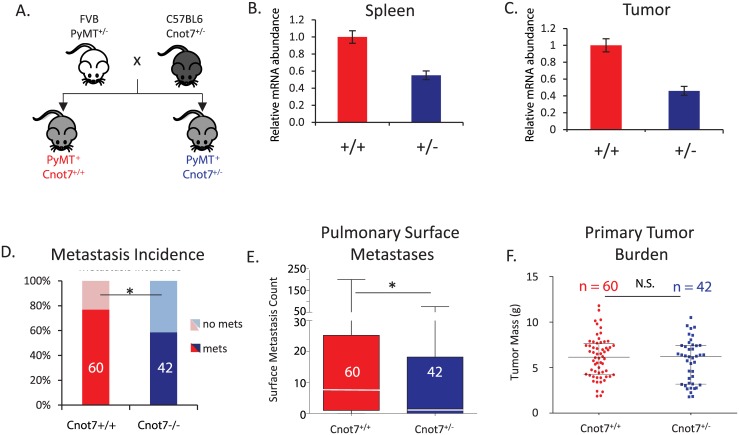
Fig 2. (A) Design of the MMTV-PyMT x Cnot7 knockout mouse cross experiment.
(B) Relative expression of Cnot7 mRNA in the spleens of control and heterozygous knockout animals. (C) Relative expression of Cnot7 mRNA in bulk primary tumors of control and heterozygous knockout animals. (D) Incidence of macroscopic pulmonary metastases (mets) for the PyMT+ Cnot7+/+ and PyMT+ Cnot7+/- animals. The number of animals in each group is indicated by the numbers in the histogram bars. (E) Mean number and standard deviation of metastases observed for the PyMT+ Cnot7+/+ and PyMT+ Cnot7+/- animals. Median values for each genotype are indicated by white line across the histogram bar. (F) Total tumor mass for the PyMT+ Cnot7+/+ and PyMT+ Cnot7+/- animals. N.S. = not significantly different. * = p< 0.05.

