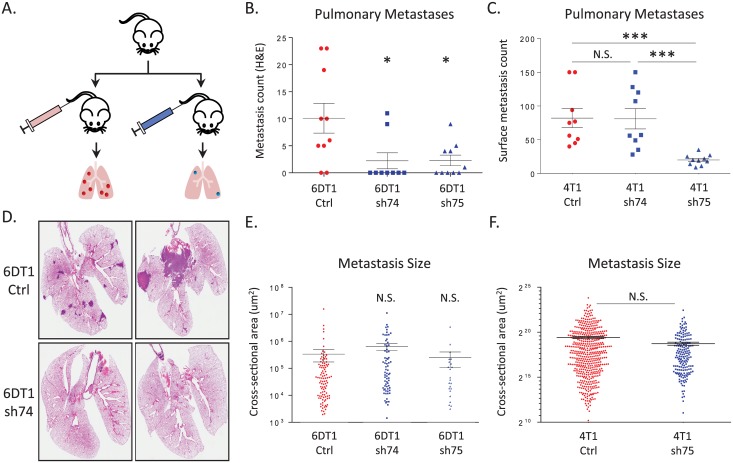
Fig 4. (A) Schematic of the experimental metastasis assay.
Surface pulmonary metastases counts for 6DT1 are displayed in (B) and in (C) for 4T1. D) Representative H&E stained lung sections are shown for the 6DT1 experiment. Relative metastasis size is indicated in panel (E) for 6DT1 and (F) for 4T1. N.S. = not significantly different. * = p< 0.05; *** = p< 0.001.

