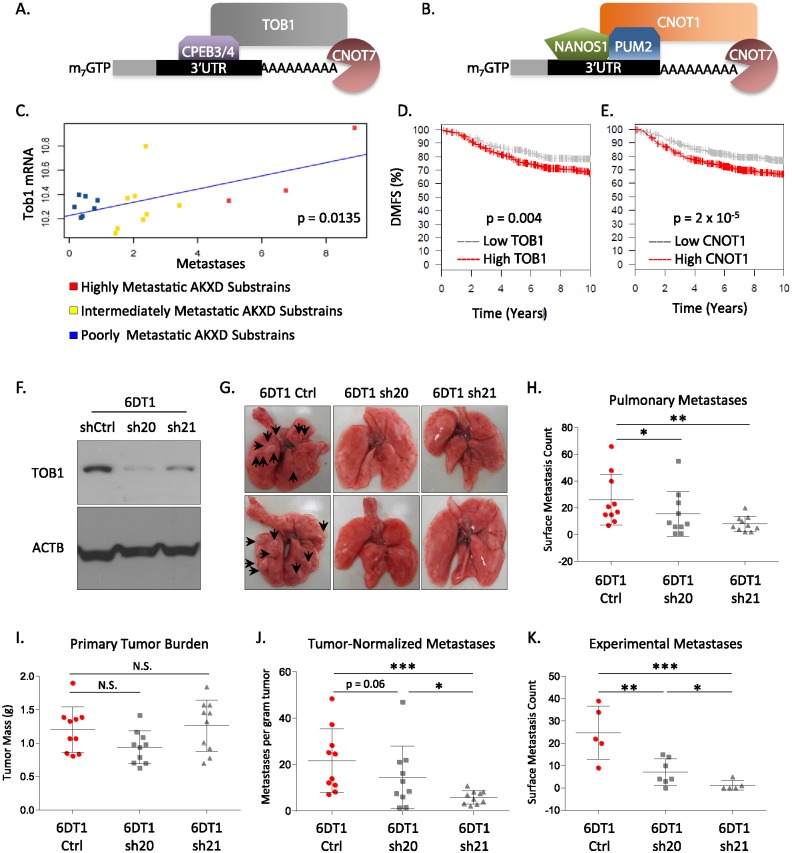
Fig 6. Schematic models of mRNA recruitment to CNOT7 by TOB1 (A) or CNOT1 (B).
Correlation plot of Tob1 expression levels with metastatic capacity in the AKXD recombinant inbred mouse panel (C). Kaplan-Meier analysis of the expression of TOB1 (D) or CNOT1 (E) and distant metastasis free survival (DMFS) in the GOBO meta-dataset. Western blot demonstrating the reduction of TOB1 mRNA levels by shRNA knockdown (F). Representative whole mounts of lungs from the Tob1 knockdown spontaneous metastasis assay (G). Dot plots for surface pulmonary metastases from the Tob1 knockdown spontaneous metastasis assay (H). Primary tumor burden for the orthotopically implanted tumors in the Tob1 knockdown assay (I). Surface pulmonary metastases for the Tob1 knockdowns after normalization by primary tumor weight (J). Dot plots of pulmonary metastases for the experimental tail vein injection assay (K). N.S. = not significantly different. * = p< 0.05; ** = p< 0.01; *** = p< 0.001.

