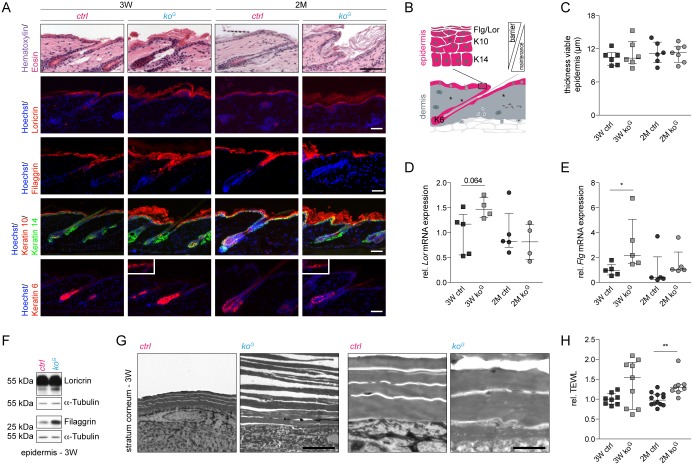
Fig 2. Progressive skin abnormalities in koG mice.
(A) H&E staining of longitudinal skin sections from mice at 3W and 2M and immunofluorescence staining for epidermal differentiation markers. Smaller pictures within the koG panel show patches of interfollicular K6. Nuclei were counterstained with Hoechst. Scale bars: 200 μm (H&E) or 40 μm (immunofluorescence). Note the scaling in koG mice. The appropriate expression pattern of the differentiation markers and their function in the epidermis are shown schematically in (B). K = Keratin, Flg = Filaggrin, Lor = Loricrin. (C) Thickness of the viable epidermis (all layers except the stratum corneum). 3W (N = 6) and 2M (N = 6/7). (D,E) qRT-PCR of Lor (N = 5/4) and Flg (N = 5) relative to Rps29 using RNA from the epidermis at 3W and 2M. (F) Western blot of epidermal lysates at 3W for Lor, Flg and α-Tubulin (loading control). Shown is one representative sample for each genotype (N = 4). (G) Electron microscopy of the stratum corneum at 3W showing reduced adhesiveness of the corneocytes in the epidermis of koG mice. Scale bars: 5.5 μm (left panels) or 2.5 μm (right panels). (H) TEWL of mice at 3W (N = 8/9) and 2M (N = 12/8). Scatter plots show the median with interquartile range. *P ≤ 0.05, **P ≤ 0.01.

