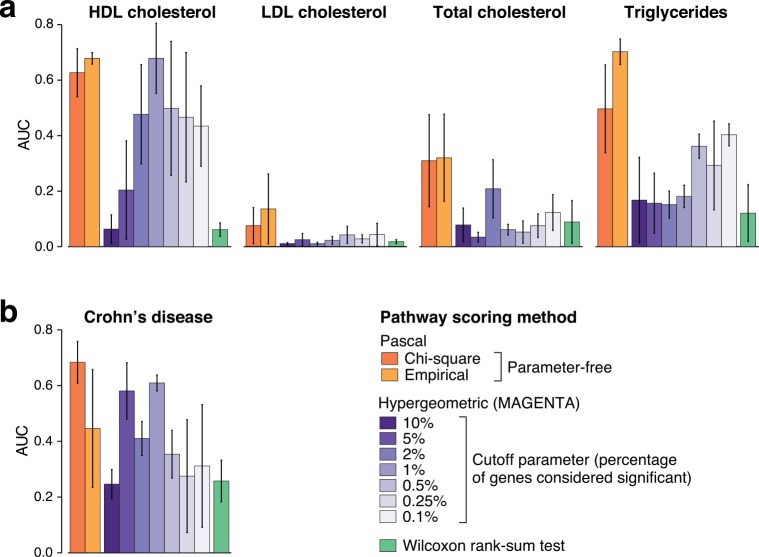
Fig 4. Performance of pathway enrichment methods for blood lipid traits and Crohn’s disease.
Displayed is the mean area under the precision-recall curve (AUC) for pathways identified using Pascal, a standard hypergeometric test at various gene score threshold levels, and a rank-sum test (vertical bars show the standard error). We show results for the max gene scores (sum gene score results are similar, see S5 Fig). a) Results for four blood lipid traits. The gold standard pathway list was defined as all pathways that show a significance level below 5×10⁻⁶ for any of the tested threshold parameters for hypergeometric tests in the largest study of lipid traits to date[23]. The significance level of 5×10⁻⁶ corresponds to the Bonferroni corrected, genome-wide significance threshold at the 0.5% level for a single method. For each phenotype, error bars denote the standard error computed from three independent subsamples of the CoLaus study (including 1500 individuals each). We see good overall performance of Pascal pathway scores, whereas results for discrete gene sets vary widely with the particular choice for the threshold parameter of hypergeometric test. b) Results for Crohn’s disease using the same approach as in (a). A reference standard pathway list was defined as in (a) using the largest study of Crohn’s disease traits to date[31]. We observe that the chi-squared strategy performs at least as well as all other strategies in this setting, whereas performance of the hypergeometric testing strategy varies.

