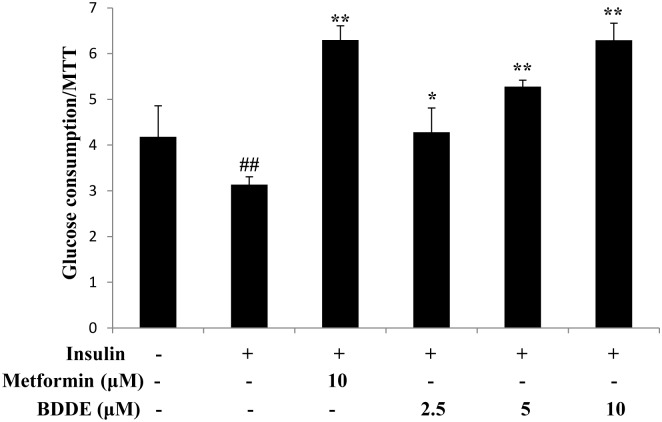
Fig 2. BDDE dose-dependently enhanced glucose uptake in insulin-resistant HepG2 cells.
Data are presented as the mean ± SD of glucose uptake divided by the optical density determined in the MTT (n = 3). ## p < 0.01 versus control cells in the absence of insulin; * p < 0.05, ** p < 0.01 versus control cells in the presence of insulin.

