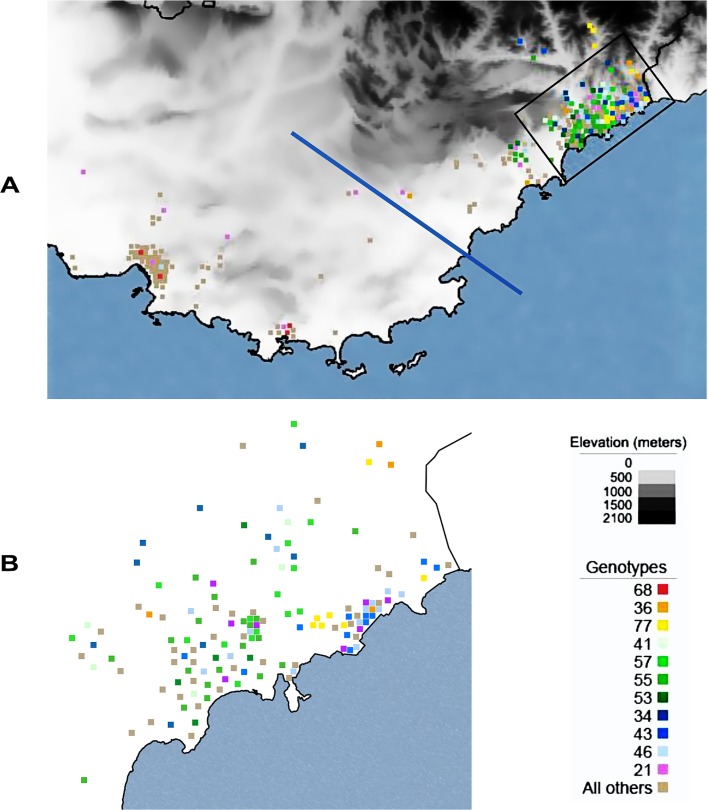
Fig 3. A. Localization of the genotypes.
Eleven repeated genotypes, which were observed in four or more isolates, are represented with colored squares on the map of the endemic areas of Alpes-Maritimes and Provence. The two endemic areas are separated by a blue line. The remaining genotypes are represented by light brown squares. The area in the black rectangle is shown in further detail in Fig 3B. B. Detailed localization of isolates in the Alpes-Maritimes endemic area and more precisely the surrounding region of Nice. Isolates were localized at the city level. The black line represents the delimitation of Nice.

