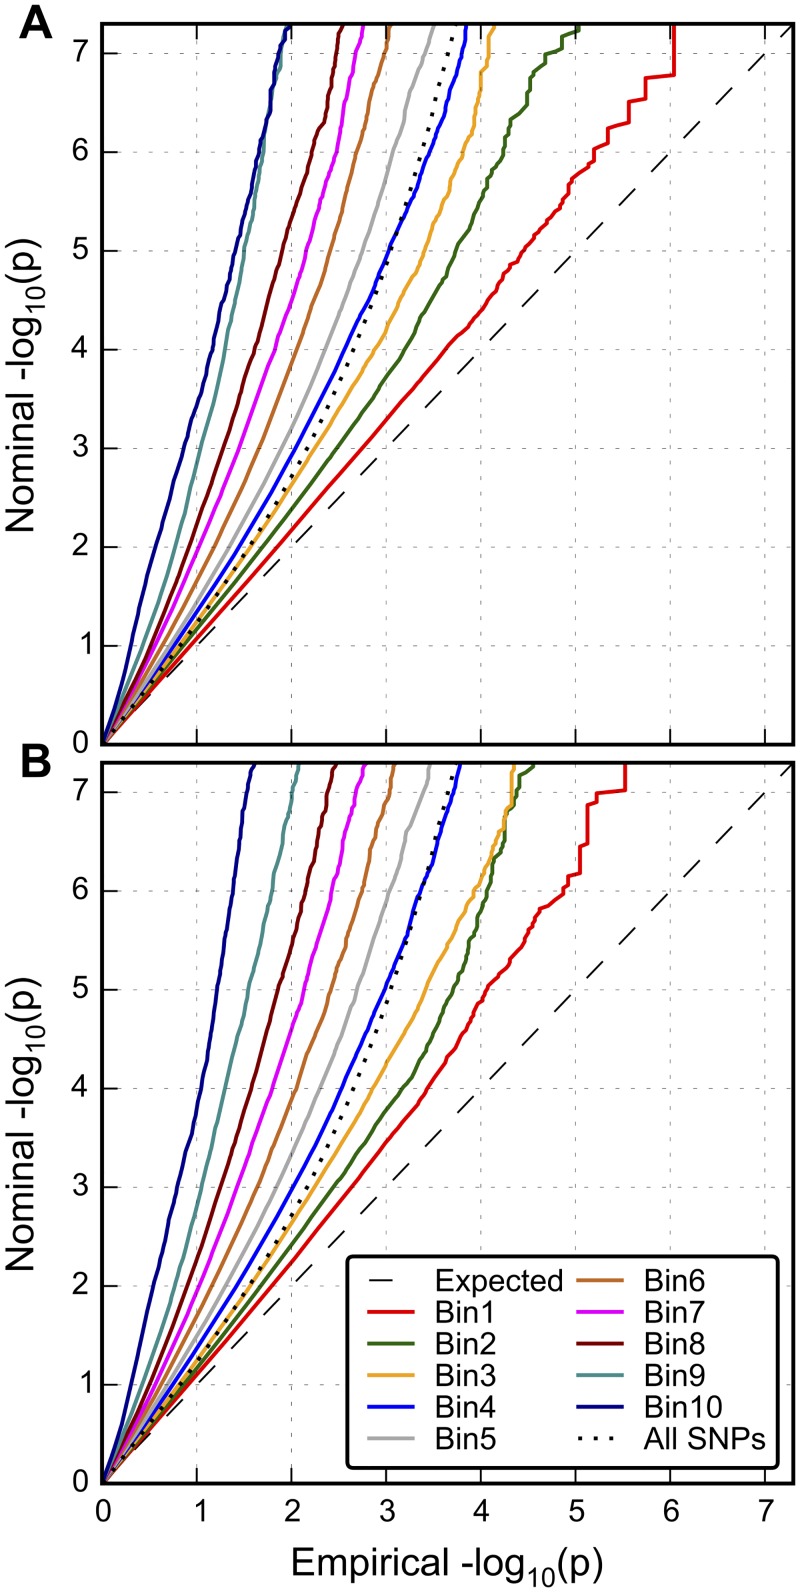
Fig 2. Enrichment of SNP associations with schizophrenia conditioned on predicted enrichment scores.
The conditional Q-Q plot shows the enrichment of SNP association with schizophrenia stratified by predicted relative enrichment scores A.) based on LD-weighted Annotation categories, heterozygosity and total LD score and B.) based on LD-weight Annotation categories, heterozygosity, total LD score and SNP association with bipolar disorder. The predicted enrichment scores are equally divided into 10 disjoint intervals or bins (from the least enriched stratum, Bin1, to the most enriched stratum, Bin10). The dashed line indicates the null distribution and dotted line indicates all SNPs, i.e., not stratified. Different colors indicate different intervals of predicted enrichment scores. The leftward shift of the each curve compared to the null line indicates the relative enrichment. SNPs in the MHC region were excluded and then pruned based on the LD structure from the 1000 Genomes European subpopulation at r2 < 0.8.

