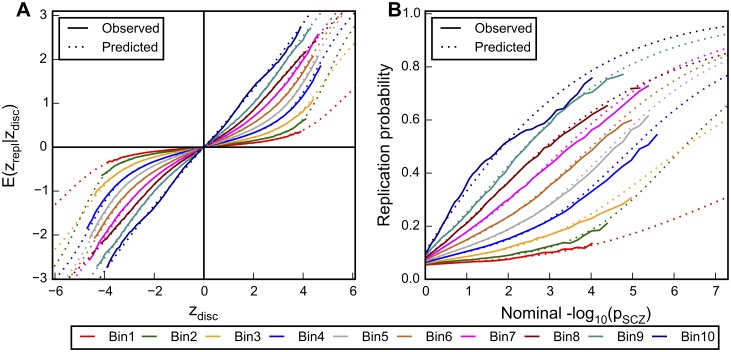
Fig 3. Mean replication z-score and replication rate stratified by enrichment scores.
A.) The observed (solid lines) and predicted (dotted lines) mean z-scores in the replication sample (y axis) were plotted against the z-scores in the discovery sample (x axis). The shrinkage of replication z-scores is differentiated by disjoint intervals of relative enrichment scores. B.) The observed (solid lines) and predicted (dotted lines) replication probabilities were plotted against the negative common logarithm of nominal p values of schizophrenia SNPs in discovery sample (x axis). Colors indicate the 10 disjoint intervals of relative enrichment scores, ranging from the least enriched (Bin1) to the most enriched (Bin10). All data were generated by randomly assigning 26 of the PGC schizophrenia sub-studies as discovery sample and 26 as replication sample (split half). The averaged value over 500 iterations was shown.

