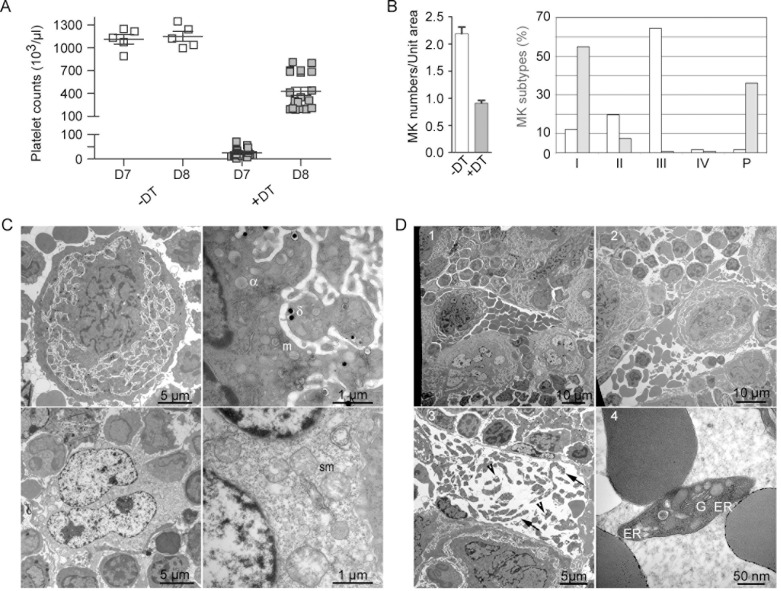
Fig 1. Enhanced megakaryopoiesis and thrombopoieisis after DT-mediated MK ablation.
F1 iDTR x PF4-Cre mice received 100 ng/day DT or saline for 4 days (first injection on day 1). PLT counts decreased during the following days and PLT rebound occurred between days 7 and 8. (A) PLT counts of saline- and DT-treated mice (n = 5 and 20, respectively) were measured on day 7 and 8. Horizontal bars indicate the mean values of the counts. Comparing the different conditions, a two way ANOVA analysis followed by a Bonferroni post-test indicated a p value of <0.001, except for saline treated samples on days 7 and 8, which displayed no significant differences. (B) On day 5, bone marrow samples from 3 saline- and 3 DT-treated mice, with two sections per sample, i.e. 6 sections per condition, were analyzed by TEM; total numbers of 172 and 133 MKs were observed, respectively. MKs were classified according to their morphology, either as classical stage I to IV, or as pycnotic cells. Left, the density of MKs per unit area (14,400 μm2) was determined on sections from untreated and treated mice; the histograms represent the mean distribution and standard deviation on the sections analyzed. Right, the percentages of the different types of MKs, including pycnotic cells, were calculated on sections from saline- and DT-treated mice. (C) Upper panels, representative images of a stage III MK from untreated mice, left whole cell, right enlarge field showing the presence of α and δ granules and mitochondria (m). Lower panels depict a typical MK from DT-treated mice with a pycnotic nucleus (left panel) and swollen mitochondria (sm)(lower right panel). (D) Representative TEM images of bone marrow sections from DT-treated mice on day 8. Note the accumulation of MKs (1), the presence of whole MKs and large fragments of MKs (2) and the presence of proPLTs (arrows), PLTs (arrow heads) (3) and retPLTs (4) in a bone marrow vessel.

