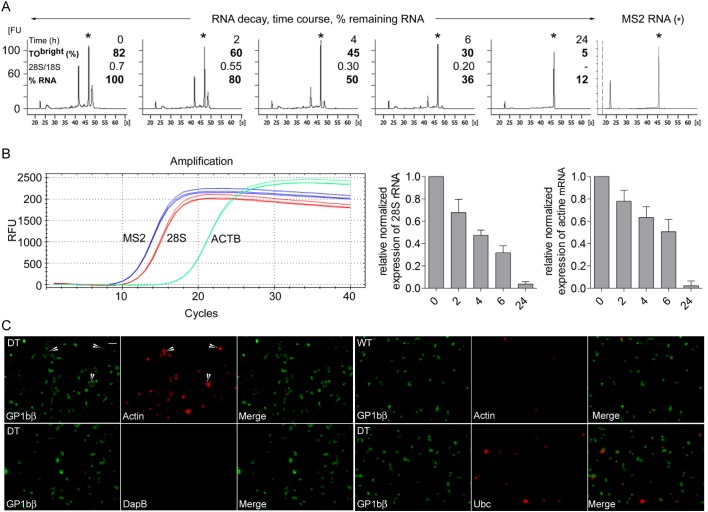
Fig 5. Decay of the quality of PLT RNA.
In another series of experiments, washed PLTs from DT-treated mice were resuspended in Tyrode’s albumin/DMEM medium and incubated at 37°C for 0, 2, 4, 6 and 24h. At the end of each time interval the percentage of TObright PLTs was determined by FC, after which PLT RNA was extracted in Trizol reagent containing MS2 genomic RNA (see methods) (n = 4). (A) The profiles of extracted RNAs were analyzed on a Bioanalyzer; a representative series of profiles is shown. Y-axis scales (fluorescence units) are identical for all the electropherograms (20 FU per subdivision). The asterisks indicate the position of MS2 RNA and the right electropherogram corresponds to pure MS2 RNA. First number, time; second number, percentage of TObright PLTs; third number, 28S/18S RNA ratio; fourth number, percentage of remaining PLT RNA. (B) The decays of rRNA and beta actin mRNA were analyzed by RT-qPCR (see details in method section). Representative amplification curves for MS2, 28S rRNA and beta actin cDNAs at time 0 are shown (1/50 diluted samples, triplicates). No specific amplification products were generated in control experiments without reverse transcriptase (not shown). The relative normalized expression of 28S rRNA and of beta actin mRNA relatively to time 0 were calculated as described in the method section. Histograms represent means and SEM from the 4 independent experiments. C) The presence of beta actin and ubiquitin C transcripts in freshly isolated control and reticulated PLTs was assessed using RNAscope technique. The stringency of the conditions was checked using B subtilis-specific DapB mRNA probes. Hybridized probes were revealed using alkaline phosphatase and HD-assay RED reagent. PLTs were then counterstained with A488-conjugated anti-GP1bβ mAb and DAPI. Upper panels, retPLTs (left, DT) and control PLTs (right, WT) labelled with actin mRNA-specific probes. The masking effect of RED reagent-derived large precipitates on anti-GP1bβ staining is illustrated by arrows. Lower left panel, retPLTs labelled with negative control DapB probes. Lower right panel, retPLTs were stained with Ubiquitin C-specific probes. DAPI staining is not shown because no cells were labelled in the chosen views. Scale bar: 10 μm.

