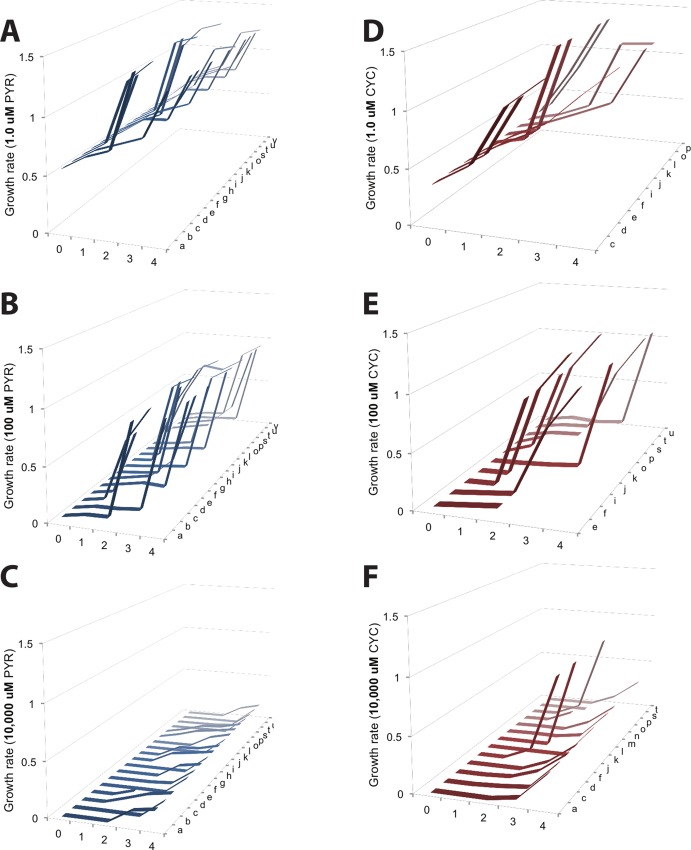
Fig 3. An illustration of how the structure of accessible adaptive trajectories differs between drug environments.
Adaptive landscapes for Plasmodium falciparum across environments are organized into their accessible trajectories across several drug concentrations of pyrimethamine and cycloguanil. We define an accessible pathway as having an increasing fitness along the steps of a pathway. The five panels correspond to PYR (A-C, in blue) and CYC (D-F, in red). The y-axis is growth rate. The x-axis denotes Hamming distance (0 = wild type ancestor, 1 = single mutants, 2 = double mutant, 3 = triple mutant, 4 = quadruple mutant), and the z-axis corresponds to the 24 different possible pathways between the wild type ancestor (0000) and maximal resistant allele (1111) (see S3 Table for pathways a-x, corresponding to each individual pathway). Note how trajectories differ as a function of drug concentration (top to bottom) and drug type (left to right). Growth rates are in terms of time-1. Concentrations: no drug (A,D), 100 uM (B, E), and 10,000 uM (C,F). Note how both the number and topography of accessible pathways vary across drug environments.

