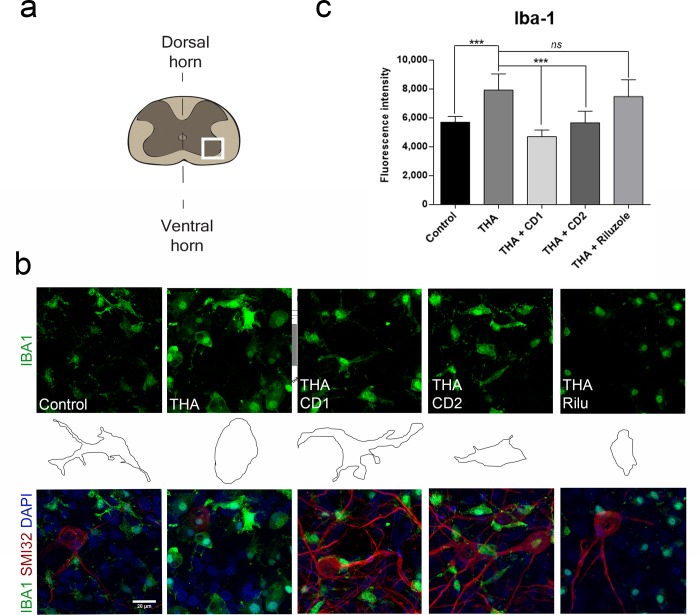
Fig 4. Reduction of microgliosis by drug combinations CD1 and CD2.
a. Schematic drawing indicating the site of analysis (white frame) of microgliosis at the ventral horn of the spinal cord slice. b. Top panels are representative microphotographs showing microglia stained with anti-Iba1 (green) at 3 weeks post-THA treatment alone or co-treated with each drug combination or riluzole. Middle panels are profile drawings of microglia showing the ameboid-like or ramified shape acquired after each treatment. Bottom panels, representative microphotographs of the merge fluorescent staining with anti-Iba1, DAPI and MNs stained with SMI-32. Scale bar, 20 μm. c. Bar graph showing the microglial reactivity of each experimental condition by measuring the immunofluorescence intensity of Iba-1 in the ventral horn of each spinal cord slice. (mean±SEM, n = 5) (***p<0.001; by Dunnett’s post-hoc test vs THA condition).

