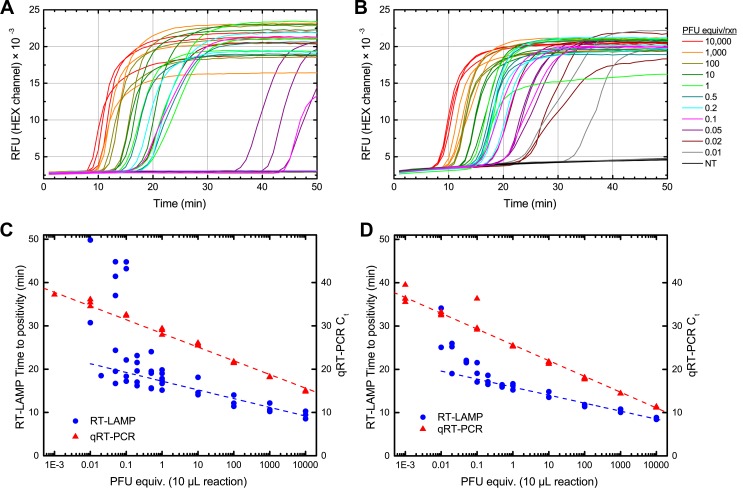
Fig 4. Quantitative analysis of SLEV and WEEV RT-LAMP.
Panels A,B: Real-time RT-LAMP amplification curves for SLEV isolate Kern 217 (A) and WEEV isolate Kern 5547 (B). Reactions were performed in triplicate with viral RNA ranging from 10,000 PFU equivalents to 0.01 PFU equivalent per 10 μL reaction. Reactions were monitored in real-time using a BioRad CFX96 thermal cycler, using the HEX channel to monitor the signal from SYTO 82; the abbreviation “RFU” refers to Relative Fluorescence Units. Panels C,D: Standard curves for SLEV (C) and WEEV (D) generated by real-time monitoring of RT-LAMP (blue circles), versus RT-qPCR (red triangles). Time-to-positivity in RT-LAMP was determined by the BioRad CFX manager software, using baseline-subtracted quantitation data.

