
Fig 1. Histological evaluation of liver.
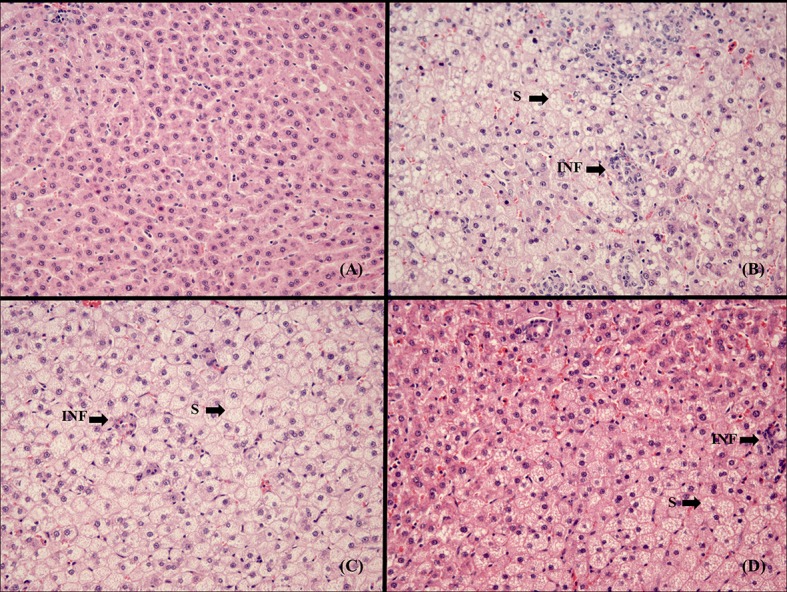
Images represent liver sections at 20x magnification of the experimental groups. (A) C, control diet; (B) CHOL-C, cholesterol enriched high saturated/high cholesterol control diet; (C) CHOL-HxT, hydroxytyrosol RP cholesterol enriched high saturated/high cholesterol diet; (D) CHOL-Si, silicon RP cholesterol enriched high saturated/high cholesterol diet; S, hepatic steatosis; INF, inflammatory cell infiltration