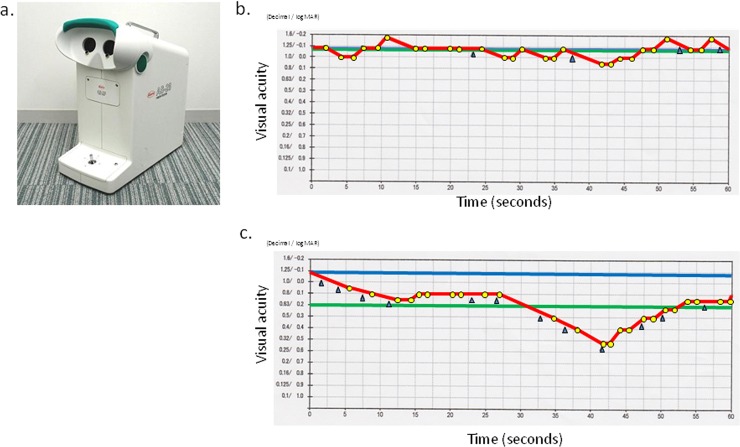
Fig 1. FVA Measurement System and results of typical cases.
(A) FVA Measurement System (AS-28, Kowa). (B) Representative printout of a typical case with good FVA. The blue line denotes the Landolt corrected VA. The red line shows the time-wise changes in the VA during testing. The green line denotes the mean logMAR VA during 60 seconds, defined as the FVA. The yellow dots indicate the number of correct responses and the blue arrows indicate spontaneous blinks. FVA (logMAR), -0.08; VMR, 0.99; max/min logMAR VAs, -0.18/0.05, respectively; ART, 1.47 seconds. (C) Representative printout of a typical case with low FVA. FVA (logMAR), 0.19; VMR, 0.83; max/min logMAR VA, 0.05/0.52, respectively; ART, 1.46 seconds.

