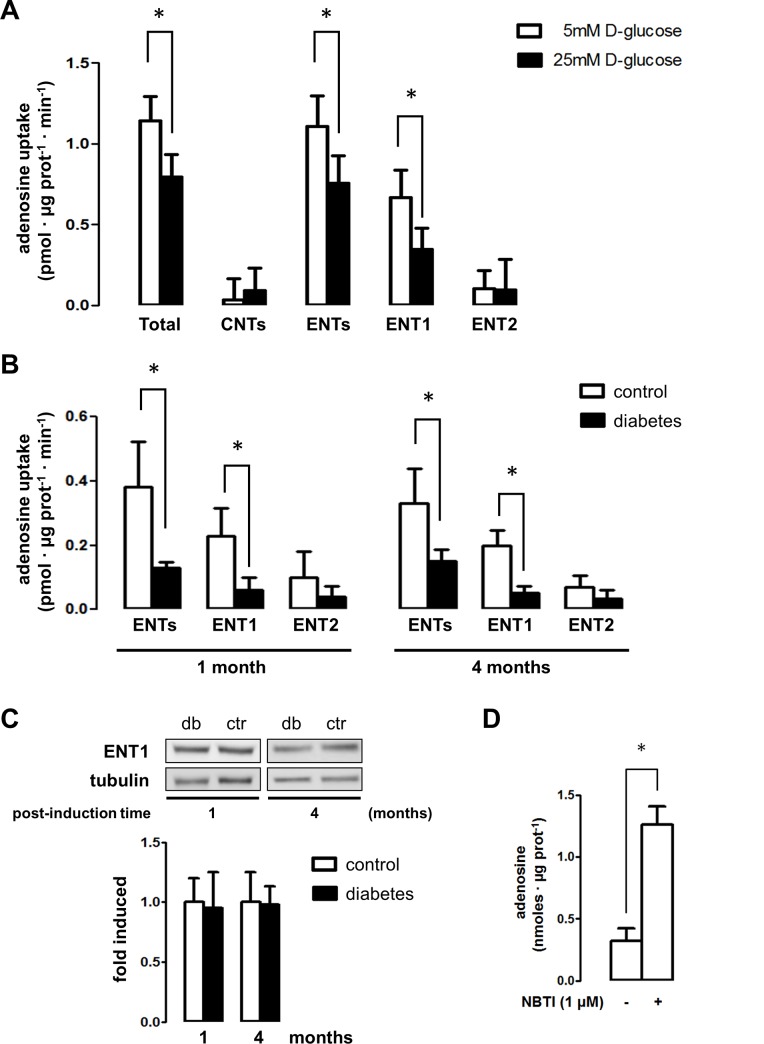
Fig 1. Nucleoside transport activity in renal epithelial tubule cells.
A. Total and particular [3H]adenosine transport activities were assayed in HK2 cells. The effect of D-glucose concentration on transport activities was assayed in HK2 cells exposed to 5mM and 25mM for 24h. Total uptake activity mediated by concentrative (CNTs) and equilibrative (ENTs) systems was obtained in transport buffer containing Na+; while ENTs-mediated uptake was determined by using a Na+ free buffer. CNTs component was derived from the difference between total transport activity in Na+ containing buffer minus the transport activity in Na+ free buffer. The graphs depict particular ENT1 mediated nucleoside uptake as the fraction of the transport in Na+ free buffer inhibited by 1μM NBTI, while the ENT2 fraction that was inhibited by 2mM hypoxanthine. Data is expressed as mean ± SD of triplicate measurements from 20 independent assays. * P < 0.05 versus 5mM D-glucose. B. Renal proximal tubules were isolated from vehicle- and STZ-treated rats following 1 and 4 months. The effect of diabetes on sodium-independent transport uptake activities mediated by ENT1 and ENT2, was quantified. Data is expressed as mean ± SD of triplicate measurements for assays using extracts from 5 animals in each group. * P < 0.05 versus control. C. The protein level of ENT1 in tubule extracts was evaluated by western blot. Representative images of western blots using diabetic (db) and control (ctr) rat extracts are shown. The graph depicts the mean ± SD of ratio between immune signals of ENT1 vs tubulin. The ratio in control extracts were normalized to 1. A statistically significant difference was not found. n = 6. D. The extracellular adenosine levels were quantified in the medium of HK2 cells exposed to NBTI, an inhibitor of ENT1 activity. Data is mean ± SD from 5 experiments. * P < 0.05 versus control.

