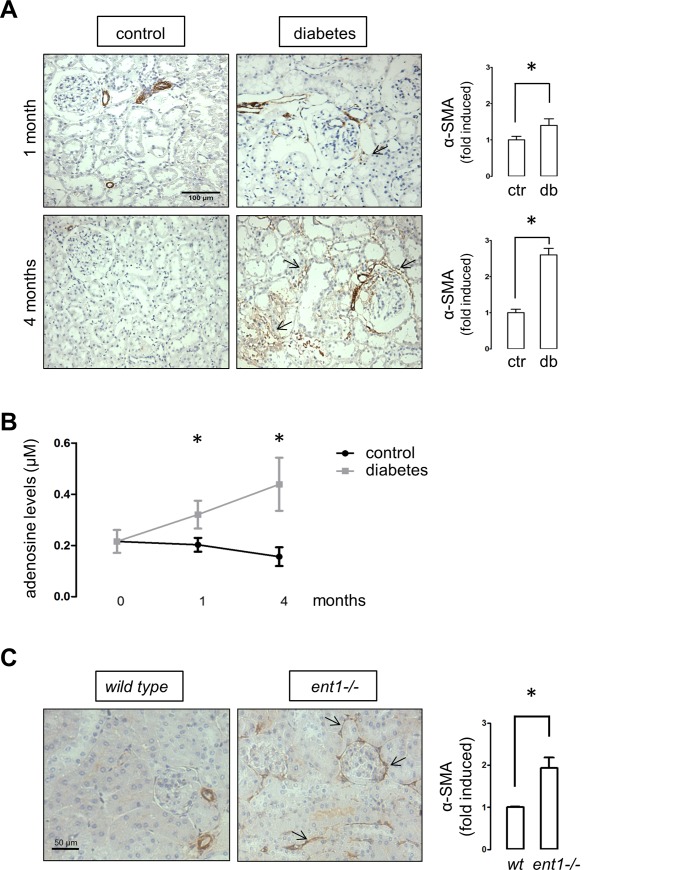
Fig 2. Evidences of renal fibrosis in diabetic rats and ent1 knockout mice.
A. Representative immunohistochemical detection of α-SMA in kidney sections from vehicle- and STZ-treated diabetic rats. The arrows indicate interstitial and periglomerular staining. B. The graph depicts plasmatic adenosine levels in control and diabetic rat groups. * P < 0.05 vs control, n = 6. C. Representative immunohistochemical detection of α-SMA in kidney sections from 8 weeks old ent1-/- and wild type mice. The graphs (A and C) show quantitative results derived from staining analyses of consecutive field from three animals per group using the UN-SCANIT 2.0 software. Values of control or wild type samples were normalized to 1. * P < 0.05 vs control or wild type. Original magnifications 200X.

