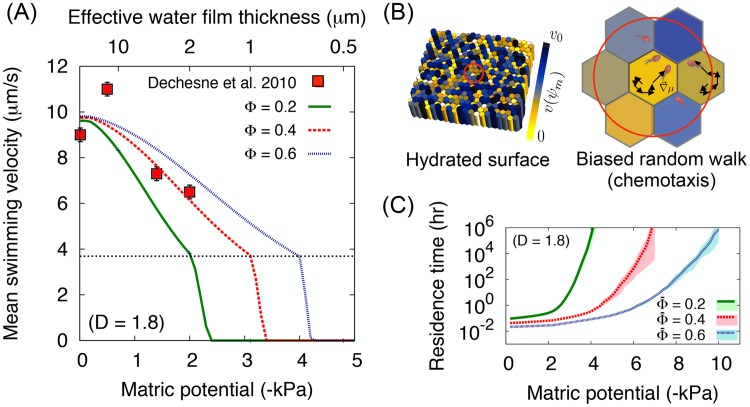
Fig 4. Microbial locomotion in rough surface patch model.
(A) The mean flagellated swimming velocity on the surface with different surface porosities for different hydration conditions expressed by matric potential (bottom axis) and effective water film thickness when Φ = 0.4 (top axis). For comparison, we fixed the fractal dimension D = 1.8 and varied the surface porosity from 0.2 to 0.6. Measured values (red squares) from the work of [89], the mean microbial swimming velocity on the porous ceramic plate, show good agreement with the model when the surface porosity is about 0.4. Black dotted horizontal line indicates the onset of capillary force. The swimming speed at the bulk water is given as v0 = 14μm/s [85]. The roughness effect and the surface porosity reduce the mean swimming velocity to about 10μm/s even at the very wet case. (B) Heterogeneity of roughness patches on the domain can be mapped to the swimming velocity field for micro-organisms. Yellow-blue scale indicates the mean swimming speed. In a patch, the microbial locomotion follows the biased random walk following the probability to cross to adjacent patches, Eq (9). (C) The averaged minimum residence time at a patch (assuming patch size lp = 500μm) varies for different roughness measures, Eq (12). For a surface with constant fractal dimension, the averaged minimum residence time at a patch is higher when the surface porosity is lower. The shaded area indicate the lower and upper values from 5 sample domains with the same mean roughness measures .

