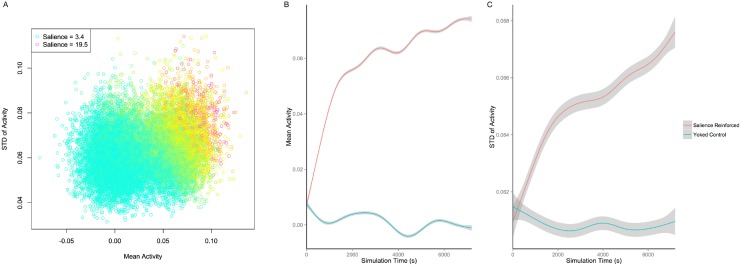
Fig 4. The relationship of muscle activity mean and standard deviation to salience and learning.
A: Each point represents one vocalization produced by five simulations of the salience-reinforced model. Data are sampled so that every fifth vocalization produced by the model is plotted here. Note that the most salient sounds tend to have both high median activity levels and high standard deviation of muscle activity, as our statistical analyses indicate. The legend shows the colors of the maximum and minimum salience points portrayed in the plot; red indicates high salience, yellow indicates moderate salience, and cyan indicates low salience. B: The mean level of muscle activity produced by the model as a function of simulation time in seconds and whether the simulation was reinforced based on auditory salience or was a yoked control. Lines are generalized additive model fits and dark gray shading gives 95% confidence intervals around those fits. When reinforced for auditory salience, the model increases the baseline level of activity of the masseter and orbicularis oris muscles, leading to greater mouth closure on average after learning. The yoked controls do not show such an increase. C: The average, across vocalizations, of the standard deviation of muscle activity within each vocalization, as a function of simulation time in seconds and whether the simulation was reinforced based on auditory salience or was a yoked control. The salience-reinforced model increases its within-vocalization change in activity of the masseter and orbicularis oris muscles, leading to greater jaw and lip movement on average after learning.

