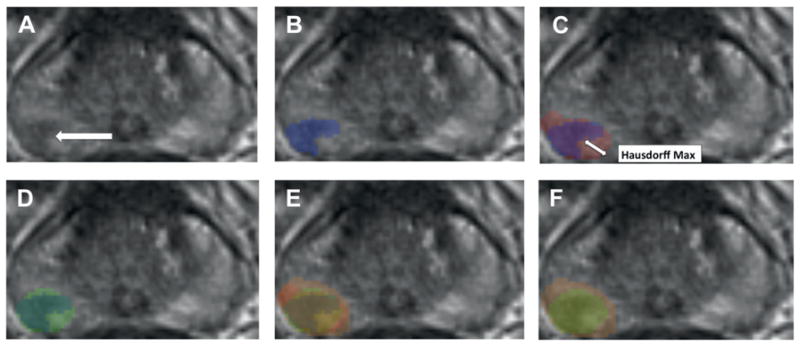
Figure 2.

Focal treatment simulations using theoretical cylinders to define treatment zone. A, axial T2WI of prostate shows right posterolateral lesion corresponding to dominant tumor on radical prostatectomy (arrow). B, MRI lesion boundaries (blue overlay). C, MRI lesion (blue overlay) superimposed on histological lesion (red overlay). D, MRI lesion (inner overlay) encompassed by cylinder estimating MRI based treatment zone (outer overlay). E, superimposition of MRI lesion (inner overlay), histological lesion (middle overlay) and cylinder estimating treatment zone to achieve complete histological destruction (outer overlay). F, superimposition of MRI based (inner overlay) and histological based (outer overlay) treatment cylinders
