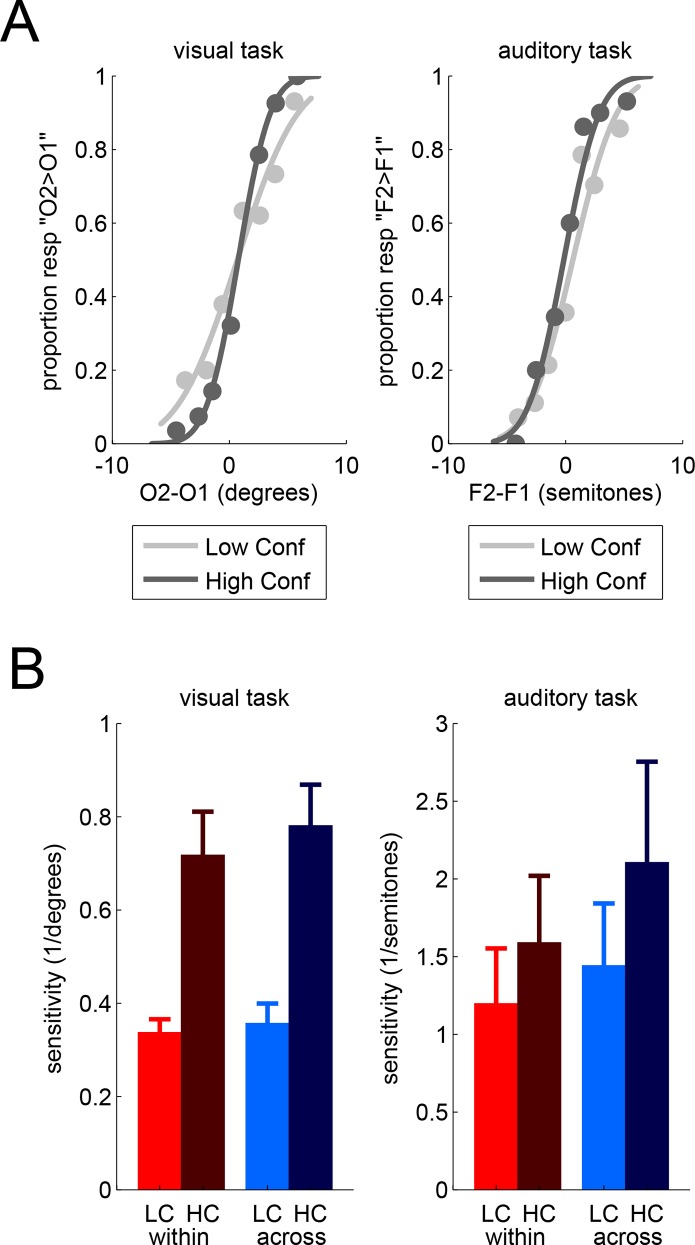
Fig 2. Psychophysical analyses.
(A) Psychometric curves for one participant in the visual task (left panel) and in the auditory task (right panel), for trials associated with higher confidence (dark grey) vs. lower confidence (light grey). Perceptual sensitivity is the inverse standard deviation of the cumulative Gaussian fit. (B) Perceptual sensitivity as a function of confidence (LC = low confidence in bright vs. HC = high confidence in dark), confidence comparison conditions (within-task in red vs. across-tasks comparison in blue), and task (visual in the left vs. auditory in the right panel). Bars represent the mean of observers with error bars for the SEM across observers.

