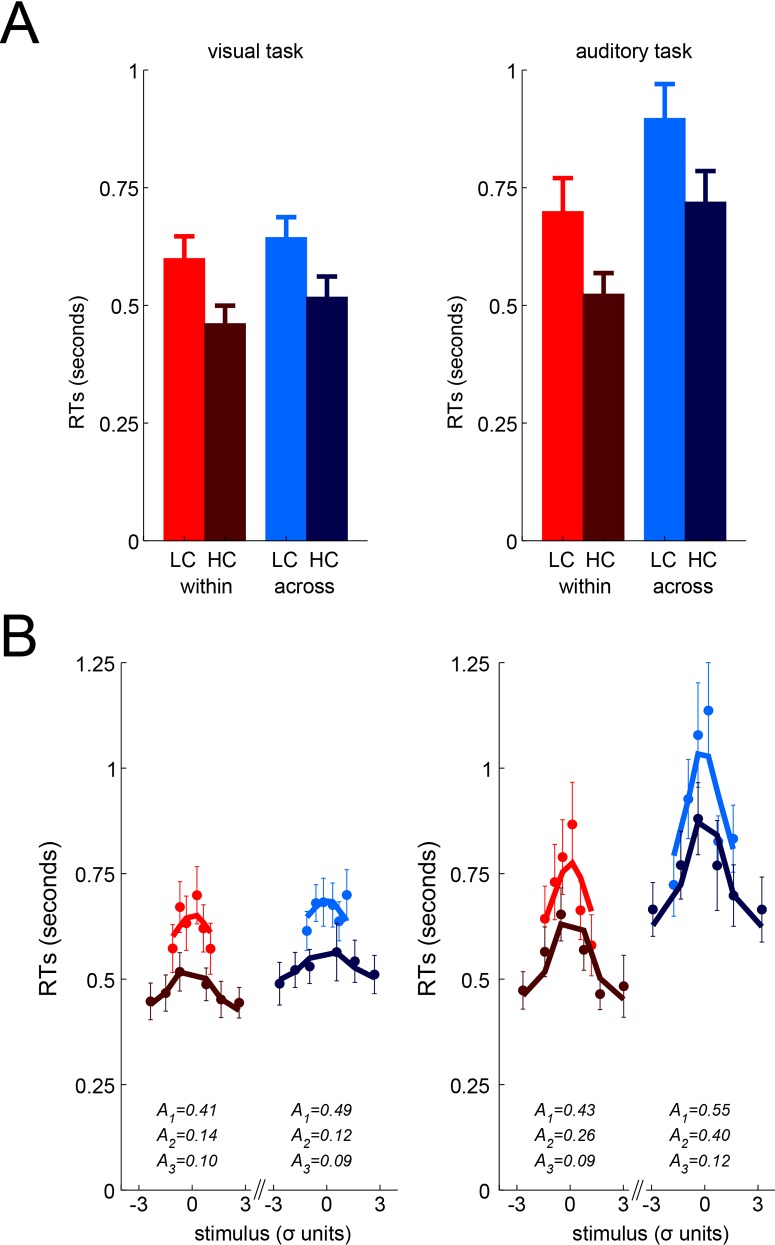
Fig 3. Response times analyses.
(A) Median response times as a function of confidence (LC = low confidence in bright vs. HC = high confidence in dark), confidence comparison conditions (within-task in red vs. across-tasks comparison in blue), and task (visual in the left vs. auditory in the right panel). Bars represent the mean of observers with error bars for the SEM across observers. (B) Control analysis isolating the effect of stimulus on RTs. Median response times for bins of stimulus values (in units of standard-deviation on the psychometric curve, see text for details). Same color conventions as in (A). Dots and error bars represent mean and SEM across observers. Lines represent the average fitted RTs in each bin. The average values of the fitted parameters are indicated for each plot.

