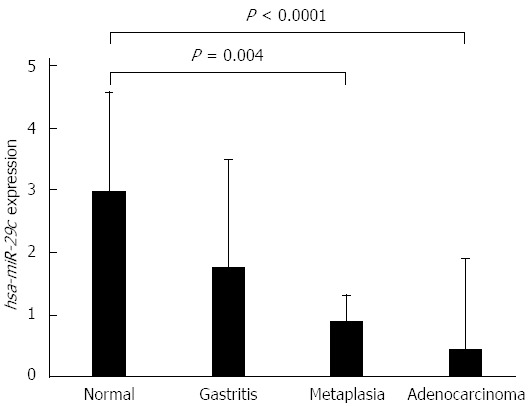
Figure 1.

Expression values of hsa-miR-29c in samples of normal gastric mucosa, non-atrophic chronic gastritis, intestinal metaplasia and intestinal-type gastric adenocarcinoma, respectively (values in log scale). P values were obtained by ANOVA test (adjusted by using Bonferroni’s correction).
