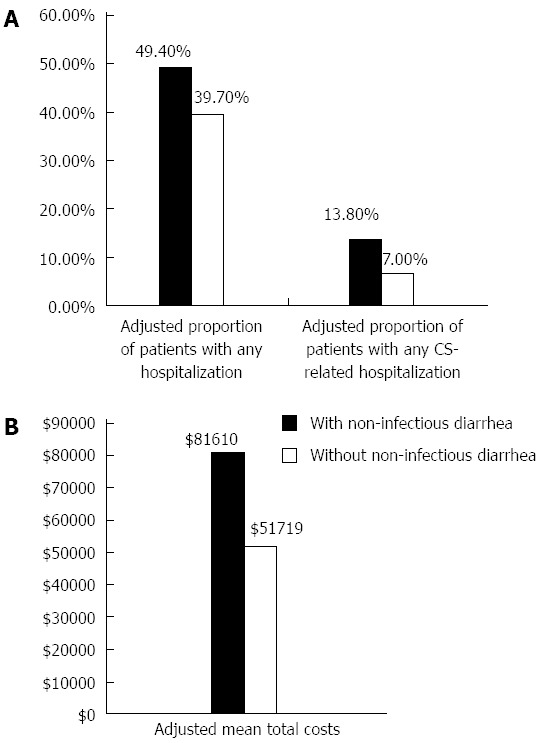
Figure 2.

Adjusted proportions of overall and carcinoid syndrome-related hospitalization and mean total costs. A: Adjusted proportion of patients with any hospitalization and carcinoid syndrome-related hospitalization by evidence of non-infectious diarrhea; B: Adjusted mean total annual costs by evidence of non-infectious diarrhea. Results were adjusted by age, gender, region, number of chronic conditions and the Charlson Comorbidity Index.
