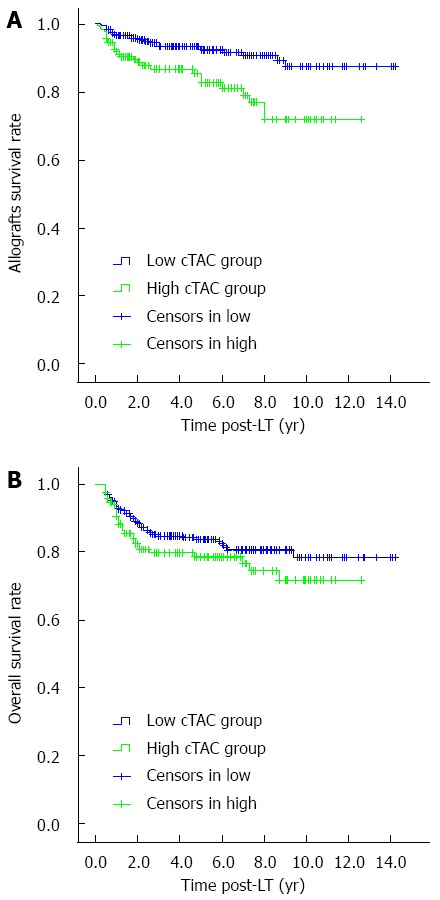
Figure 4.

Survival rates of recipients in low and high mean tacrolimus trough concentration groups (P < 0.05). A: Allograft survival rates; B: Overall survival rate (P = 0.129). Low mean cTAC group: mean cTAC < 5.89 ng/mL; High cTAC group: mean cTAC ≥ 5.89 ng/mL. cTAC: Tacrolimus trough concentration; LT: Liver transplantation.
