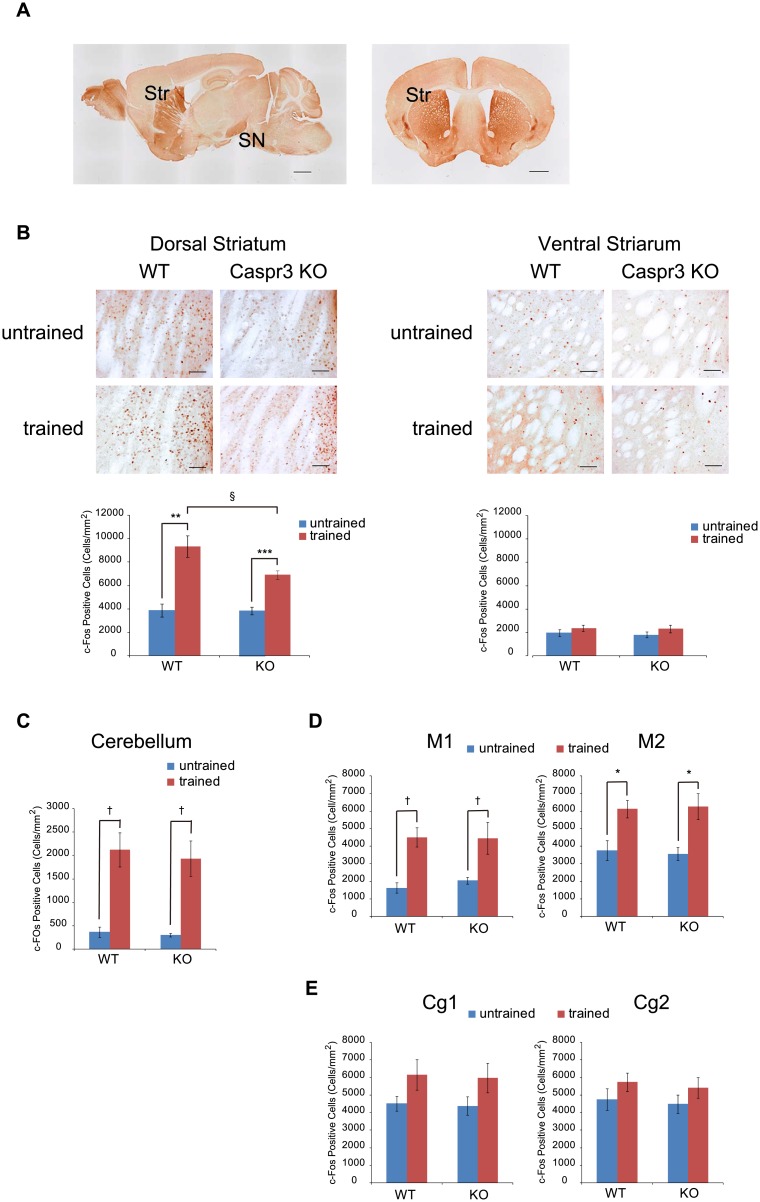
Fig 3. Quantification of c-Fos-expressing cells in WT and Caspr3-KO mice after training on the accelerated rotarod.
[A] Localization of Caspr3 in adult WT mice. Caspr3 was strongly expressed in the striatum (Str) and substantia nigra (SN). Expression of Caspr3 in the striatum was stronger in the medial area than in the lateral area. Scale bars: 1 mm. [B–E] Comparison of the number of c-Fos-expressing cells in several brain regions between WT and Caspr3-KO mice after training in the accelerated rotarod task. Significant increases in the number of c-Fos-positive cells were observed in the dorsal striatum of WT and Caspr3-KO mice after the training. However, the number of c-Fos-positive cells after the training was lower in Caspr3-KO mice than in WT mice [B]. Scale bars: 100 μm. The number of c-Fos-positive cells in the ventral striatum was not significantly different between the two genotypes [B]. In the cerebellum [C] and motor cortex [D], c-Fos-positive cells were increased after the training in both WT and Caspr3-KO mice, but there was no significant difference between the two genotypes. No significant differences were detected in the number of c-Fos-positive cells in the cingulate cortex [E] between the two genotypes. §p < 0.10, *p < 0.05, **p < 0.01, ***p < 0.001 by t-test with Bonferroni correction (number of comparisons was four). †p < 0.05 by Mann-Whitney test with Bonferroni correction. n = 6 untrained mice per genotype; n = 6 trained WT mice; n = 7 trained Caspr3-KO mice. Error bars represent SEM.

