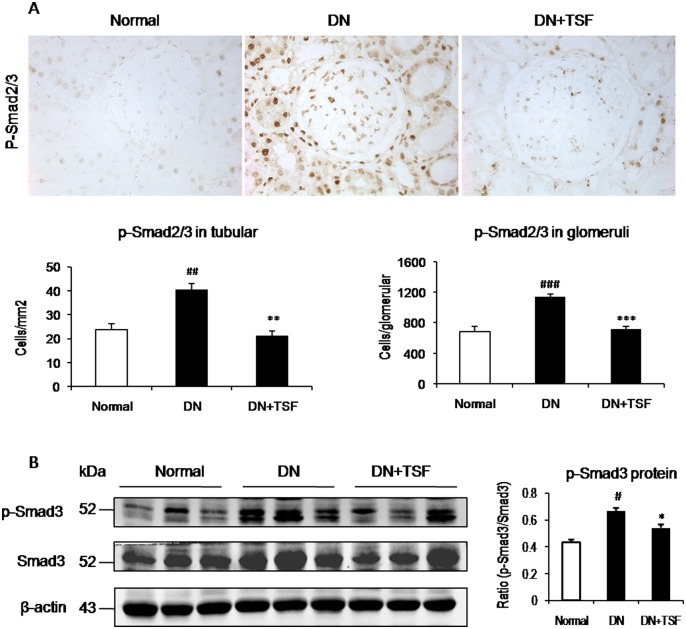
Fig 6. TSF blocks activation of Smad2/3 in DN rats.
(A) Immunohistochemistry and semi-quantitative analysis of phosphorylated Smad2/3 nuclear location in the glomeruli and tubulointerstitium. Original magnification, × 400. (B) Western blot and semi-quantitative analysis of renal phosphorylation of Smad3 (p-Smad3) and Smad3. Data are expressed as means ± SE for each group of 9rats. *P<0.05, **P<0.01 TSF-treated group vs. DN group; #P<0.05, ##P<0.01, ###P<0.001 DN group vs normal group.

