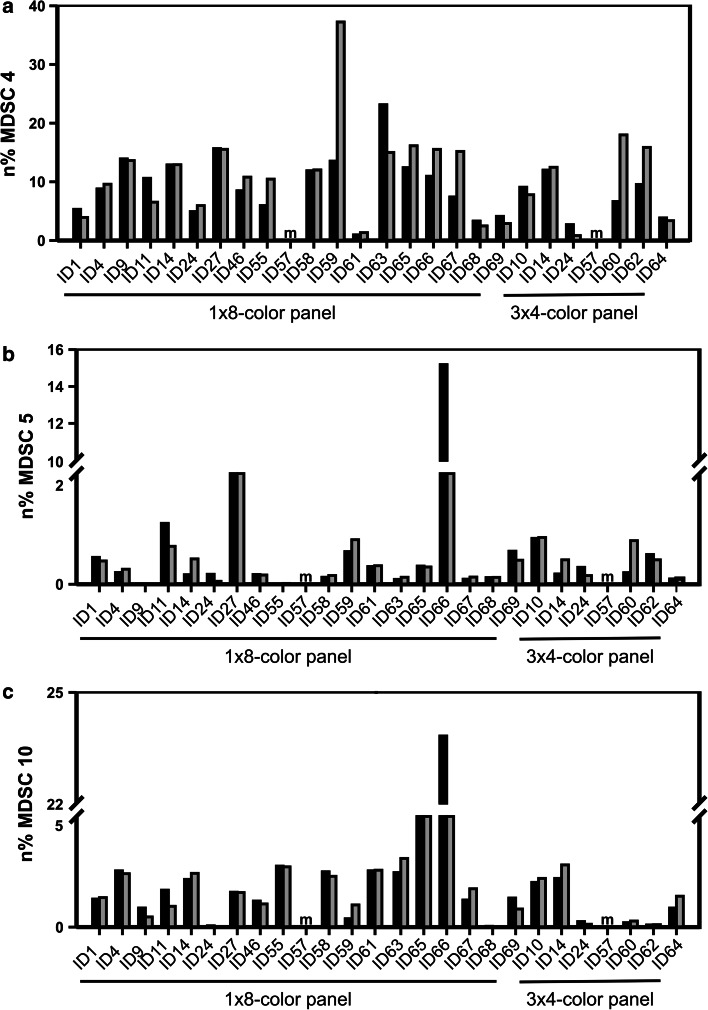
Fig. 3.
Values of a representative subsets of monocytic (MDSC4 – panel a), granulocytic (MDSC5 – panel b) and immature (MDSC10 – panel c) MDSCs are shown as examples. Frequencies were normalized on the count of lymphocytes + monocytes for each laboratory performing either one 8-color panel or three 4-color panels for MDSC identification; the two paired histograms refer to the two independent experimental runs performed by each laboratory (black bars = first run, gray bars = second run). Missing values, not reported by single laboratories, were labeled with “m”

