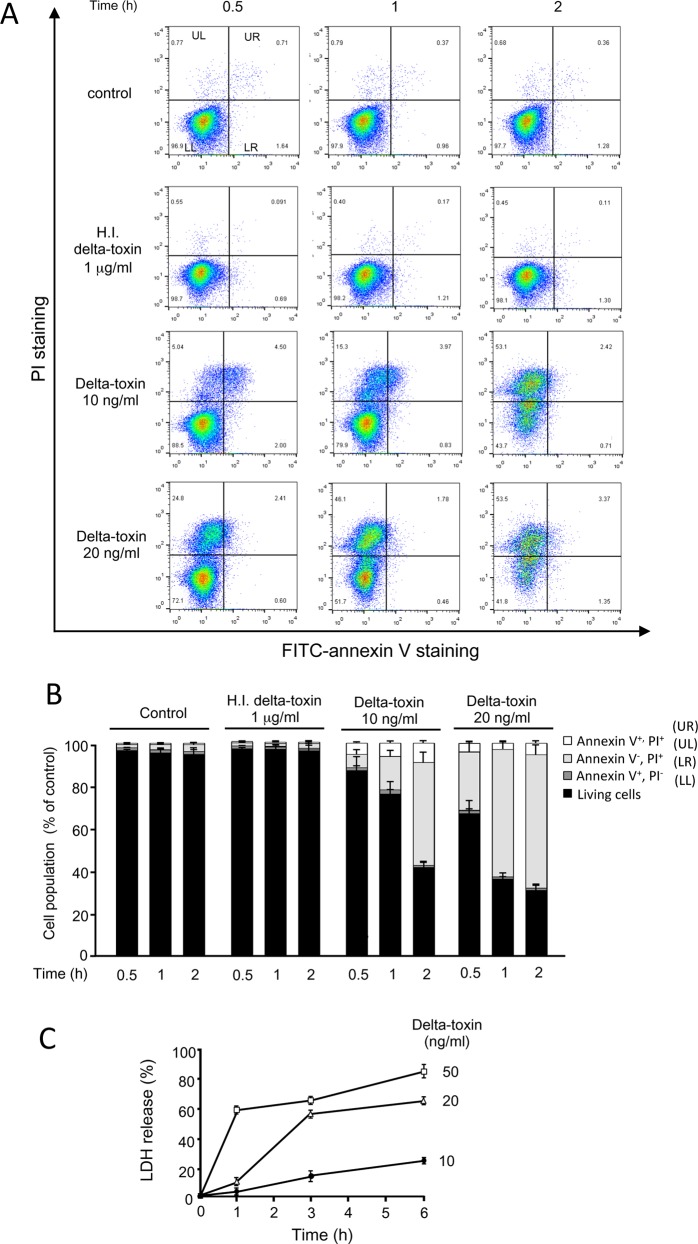
Fig 5. Cytotoxic effect of delta-toxin on A549 cells.
(A) A549 cells were treated with heat-inactivated (H.I.) delta-toxin (1 μg/ml) or delta-toxin (10 and 20 ng/ml) for the indicated time periods at 37°C. After washing, the cells were detached using trypsin, stained with propidium iodide (PI) and annexin V, treated for 15 min at 25°C and assessed by flow cytometry. Percentages of cells of each quadrant are shown in each dot-plot graph. Quantitative analysis of the staining is shown in (B). The values are the mean ±s tandard deviation (SD) of four experimental studies in each group. (C) A549 cells were incubated with delta-toxin (10, 20, and 50 ng/ml) at 37°C for the indicated time periods before lactate dehydrogenase (LDH) was measured. The means ± standard deviation (SD) of four independent experiments are shown.

