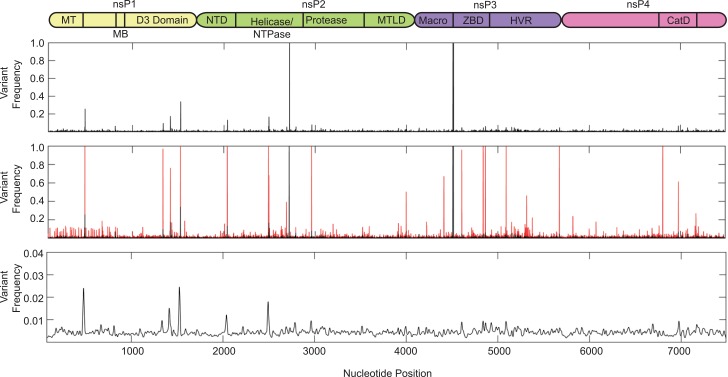
Fig 2. Minority variant analysis of chikungunya virus nonstructural proteins.
Schematic representation of the chikungunya virus nonstructural proteins is represented above the graph. Nonstructural domains represent the following: nsP1, nonstructural protein 1, genome nucleotides 77–1681, MT = methyltransferase domain (amino acids 1–170), MB = membrane binding domain (amino acids 171–300); nsP2, nonstructural protein 2, genome nucleotides 1682–4072, NTD = N-terminal domain, MTLD = methyltransferase like domain; nsp3, nonstructural protein 3, genome nucleotide 4073–5653, ZBD = zinc binding domain, HVR = hypervariable region (amino acids 328–530); nsP4, nonstructural protein 4, genome nucleotides. 5654–7489, CatD = catalytic domain (amino acids 365–479). Variants expressing a frequency of greater than 0.001 were used for analysis. Top graph represent the mean variant frequency over all samples. Middle graph represents the mean frequency (black) and variant range (red) over all samples. Bottom graph represents mean variant frequency smoothed with a Gaussian kernel.

