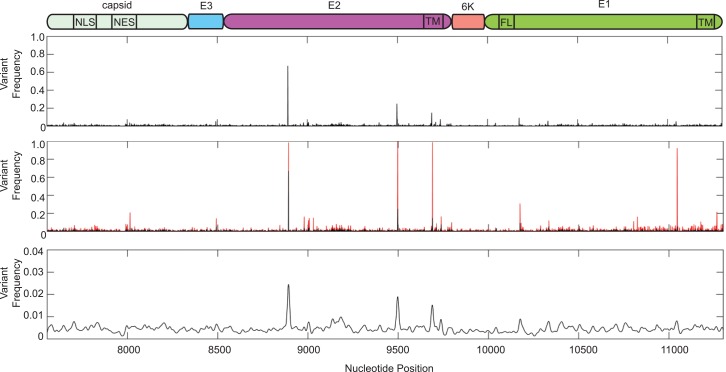
Fig 3. Minority variant analysis of chikungunya virus structural proteins.
Schematic representation of the chikungunya virus structural proteins is represented above. Capsid, genome nucleotides 7555–8337, NLS = nuclear localization signal (amino acids 60–99), NES = nuclear export signal (amino acids 143–155); E3, genome nucleotides 8338–8529; E2, genome nucleotides 8530–9801, TM = transmembrane domain (amino acids 363–391); 6k, genome nucleotides 9802–9981; E1, genome nucleotides 9982–11301, FL = fusion loop (amino acids 83–101), TM = transmembrane domain (amino acids 413–436). Variants expressing a frequency of greater then 0.001 were used for analysis. Top graph represent the mean frequency over all samples. Middle graph represents the mean frequency (black) and variant range (red) over all samples. Bottom graph represents mean variant frequency smoothed with a Gaussian kernel.

