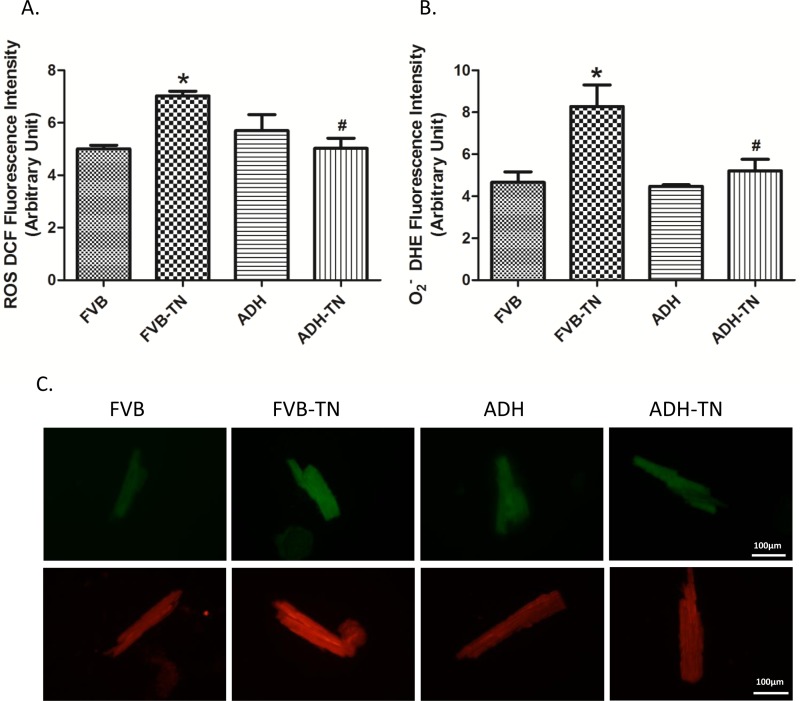
Fig 5. Assessment of oxidative stress using ROS and O2- production in cardiomyocytes from FVB and ADH transgenic mice treated with or without tunicamycin (TN).
A. ROS production assessed using DCF fluorescence; B. O2- production assessed using DHE fluorescence; and C. Representative cell images of DCF (top panel) and DHE (lower panel) staining from FVB, FVB-TN, ADH, and ADH-TN groups. Mean ± SEM, n = 3 experiments per group, *p < 0.05 vs. FVB group, # p < 0.05 vs. FVB-TN group.

