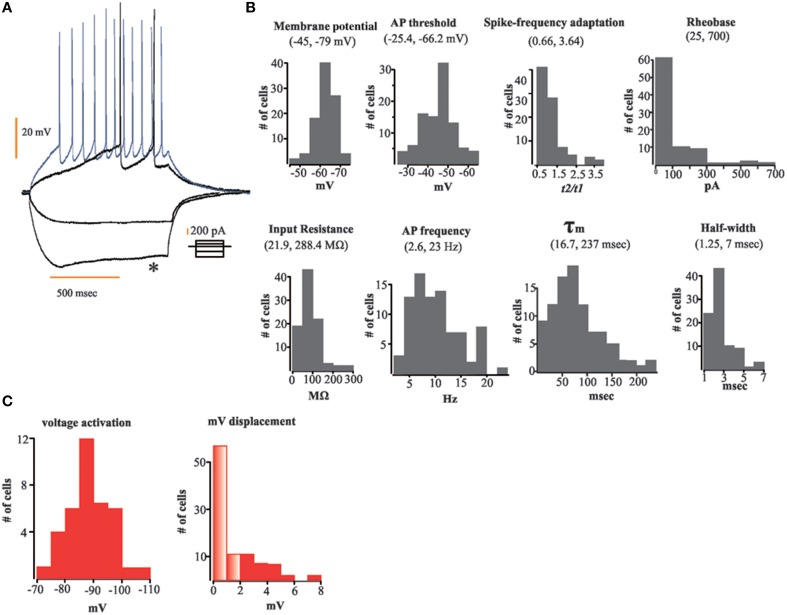
Figure 1.
Data distribution (histograms) of the electrophysiological variables measured. (A) Representative traces of our current injection protocol; depolarizing and hyperpolarizing current steps were applied to each neuron to disclose their electric properties; note sag potential (asterisk). (B) Histograms of electrophysiological variables measured; from top to bottom and left to right: membrane potential, action potential (AP), threshold, spike-frequency adaptation, Rheobase, input resistance, AP frequency, τm, and half-width. (C) Frequency histograms of voltage activation (left) and voltage displacement (right) of neurons showing sag potential (n = 35); transparent bars designate number of cells without a sag potential (differences ≤ 2 mV between peak and steady-state membrane voltage upon hyperpolarizing current injection).

