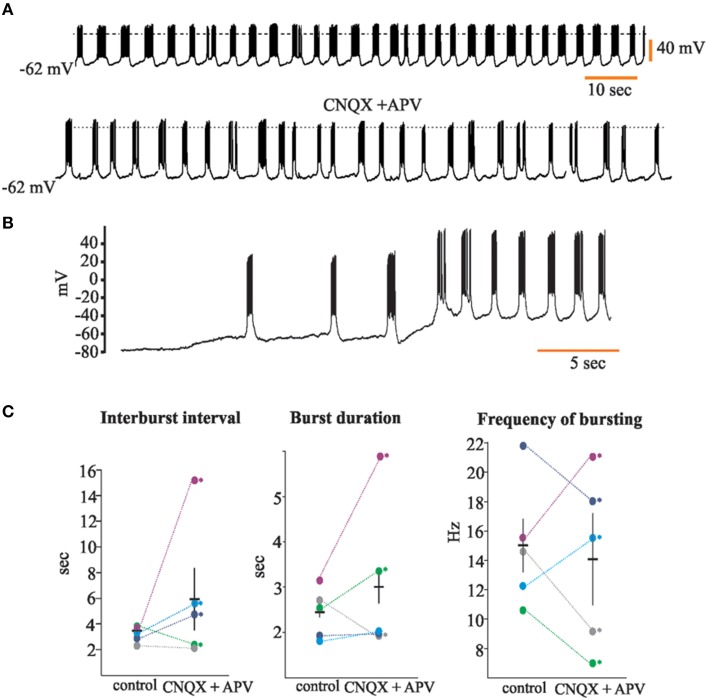
Figure 3.
Accessory olfactory bulb (AOB) neurons display voltage-dependent bursts of action potentials. (A) Trace of spontaneous activity from a representative “rhythmic” neuron of the AOB (top); when cells are incubated with glutamatergic antagonists CNQX and APV (20 μM), rhythmic bursting persists (bottom); dotted line is 0 mV (B) Rhythmic firing of AOB neurons is voltage-dependent. (C) Dot plots showing analysis for inter-burst interval (left), burst duration (center), and bursting frequency (right). Each color represents a single neuron (n = 5). Statistical differences in control vs. CNQX + APV were only found within single neurons (asterisks).

