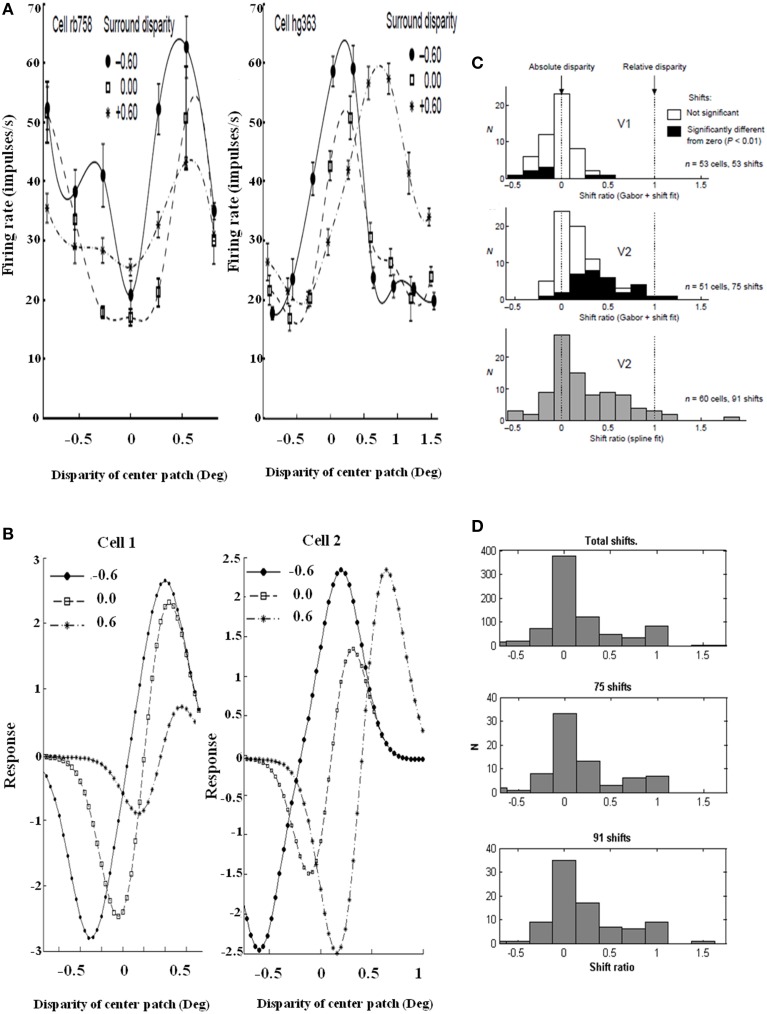
Figure 12.
Relative disparity data and simulations. (Left panel) Sample cell data from experiments and model: (A) Experimental data of two V2 cell responses for relative disparity (Reprinted with permission from Thomas et al., 2002). (B) Two model V2 layer 4 neurons with disparity tuning curves with changes in surround disparity. The model neurons simulate the position of data peaks and their shifts, but not all aspects of the amplitudes in the data. This is due to the simplicity of the model. Despite the simplicity, the model is capable of capturing the key shift properties. (Right panel) Shift ratio statistics. The shift ratio is defined as the shift in peaks of the tuning curve relative to the difference, or shift, of surround disparities. The shift ratio summarizes the statistics of the type of disparity observed: (C) Shift ratio summary reprinted with permission from Thomas et al. (2002). (D) Shift ratio summary from the model showing best results with D− = 0.2 and σinh = 1.0. An exhaustive number of combinations would have required permutations derived from choosing two surrounds without repetition from a set of 200 cells, leading to 19,900 permutations. However, the best available data from Thomas et al. (2002) have a maximum of 91 shifts, so a random selection was compared with their summary statistics. This random selection chose, for each cell, four shift ratios to derive a total of 1600 shifts and 800 shift ratios. These shift ratios were, in turn, randomly sampled without replacement to select 75 and 91 shifts, respectively, to match the number of shifts computed in the experimental data [Reprinted with permission from Grossberg et al. (2011)].

