Figure 15.
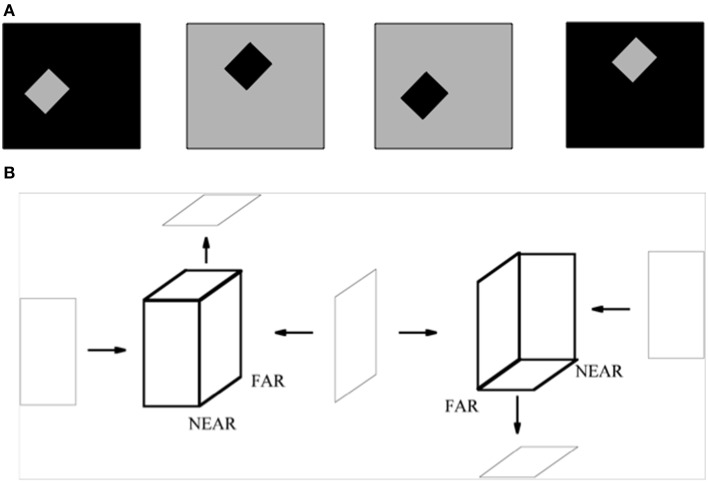
(A) The standard test for determining the effect of border ownership on edge responses. In the left two images, identical contrast edges are presented in the recorded receptive field. In the left-most figure, the light-dark edge is at the right side of a light square. In the figure to its right, it is at the left side of a dark square. The relation is analogous between the right two images, with reversed contrasts. Adapted from Zhou et al. (2000). (B) 2D pictures can appear flat or slanted in depth. The two figures in bold lines are made of same set of surfaces, but due to the different arrangement of their surfaces, they give rise to different slanted 3D percepts, even though the figural sides from which they are composed can individually be perceived as flat. The left bold figure has a positive tilt (near-to-far), while the right bold figure has a negative tilt (far-to-near). The tilts of near-to-far vs. far-to-near straight lines are determined by the combinations of angle cells between which they lie. The corresponding combinations of surrounding angle cells and straight bipole cells are associated with each other during normal 3D vision. Reprinted with permission from Grossberg and Swaminathan (2004).

